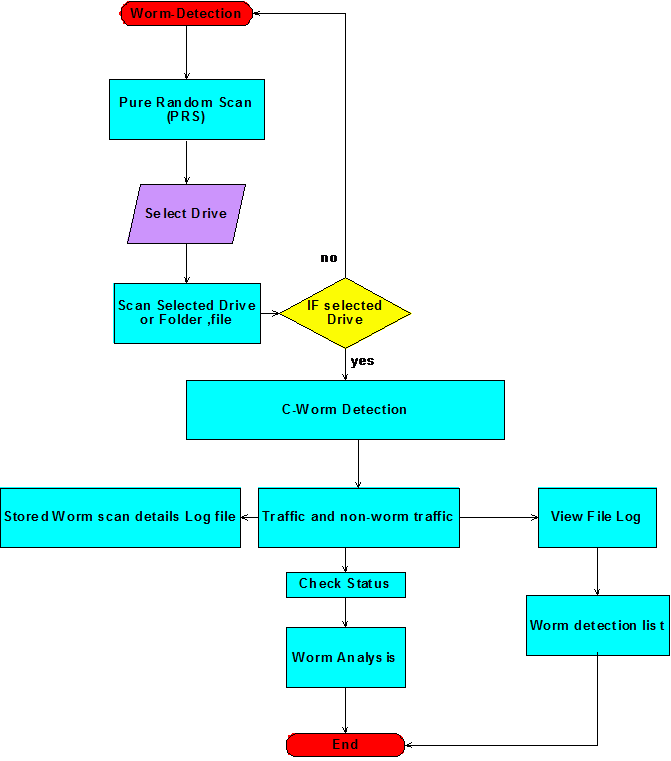
Data flow application
The complete dataflow of the proposed design is as shown in the above figure. From the above figure it is clear that the initial process of the application beings with the step Pure Random Scan (PRS) algorithm and this algorithms scans the desired drives, folder or files as per the user choice as discussed in the previous section. If the user selects the desired file or folder or drive, the scan proceeds with C-worm detection and if no item is selected the algorithm will detect the normal virus and worms as shown in the dataflow diagram.
C-Worm detection can be categorized in to two important types like normal traffic detection and C-worm traffic detection and these two steps are given in the flow chart as shown above. Once the non-worm traffic and worm traffic are identified the corresponding details of the scan process are saved against the log file and this log can be viewed by the users to track the details of the worms and the corresponding affects made by the worm on the system drives, folders and files. A separate log file is also created to track the information of all infected files and this log file can be viewed to track the information of the corresponding infected files.
A worm detection list is also maintained once the log files are created and this list provides the complete information of all the files being affected by the C-worms along with their complete path information like parent directory and parent folder as well. Status of the worms and their corresponding affects can also be tracked and a separate option is provided for this as shown in the above dataflow diagram and this status can be tracked with the help of a separate analyzer.
This analyzer scans the complete log files one more time and a graph is generated against the detection rate and detection time and this graph can be used to understand the overall performance of the algorithm developed. To summarize this dataflow diagram ,t he initial step of the worm detection starts with the algorithm and ends when the analyzer displays the required graph against the detection time and the detection rate as shown in the above flow chart.
Key steps involved in this process are scanning the drives, scanning the user drive, folders and files as per the user choice and maintain the desired log files and maintain the list of C-worm infected files along with few details like the location of the file or folder and the drive and the level of impact and change done with the corresponding file infected are maintained in this log and is shown in the above dataflow diagram.

