The aim of this Covid-19 Outbreak Prediction project is to make a model which will forecast the number of confirmed cases covid-19 virus in the upcoming days. Covid-19 is an infectious disease that is affecting a huge number of people all around the world.
This virus was first identified in Wuhan, China, and later spread throughout the world causing a pandemic that forced most countries to go into lockdown.
Various machine learning models and time series forecasting models.
The predictive model will be created using machine learning and using the dataset obtained from Kaggle. Machine learning automates the formation of analytical models. It is a branch of artificial intelligence focused on the principle that data can be learned from processes, It can find patterns and take decisions.
Time series forecasting will be used which is a type of predictive model. Time series forecasting is the use of a model centered on earlier observed values to evaluate future values.
INTRODUCTION
The aim of this project is to make a predictive model which will predict the trajectory of the outbreak of the covid-19 virus in the upcoming days. Covid-19 is an infectious disease that is affecting a huge number of people all around the world.
It was first identified in Wuhan, China, and then later spread all over the world causing a pandemic.
Since no vaccine is developed which can be available all throughout the world, we have to take preventive measures which can stop the spread of the disease. Since a lockdown cannot last forever, we have to know how fast the spread is and how much more people will be infected.
The predictive model will be created using machine learning and using the dataset obtained from Kaggle. Machine learning automates the formation of analytical models. It is a branch of artificial intelligence focused on the principle that data can be learned from processes, It can find patterns and take decisions.
Time series forecasting will be used which is a type of predictive model. Time series forecasting is the use of a model centered on earlier observed values to evaluate future values.
PRESENT SYSTEM
Various work on this problem related to covid-19 is being done. Officials all over the world are using several outbreak prediction models for covid-19 to make informed decisions and implement relevant control measures. Simple statistical models have received greater attention from authorities among the standard models for covid-19 global pandemic prediction. One of the works suggests using SEIR models. SEIR means susceptible-exposed-infected-recovered model.
This model aims to forecast factors like the spread of a disease, the total number of infected, and the span of an outbreak, and estimate different epidemiological parameters like the number of reproductive. Such models can illustrate how the outcome of the disease can be affected by various public health measures.
PROPOSED SYSTEM
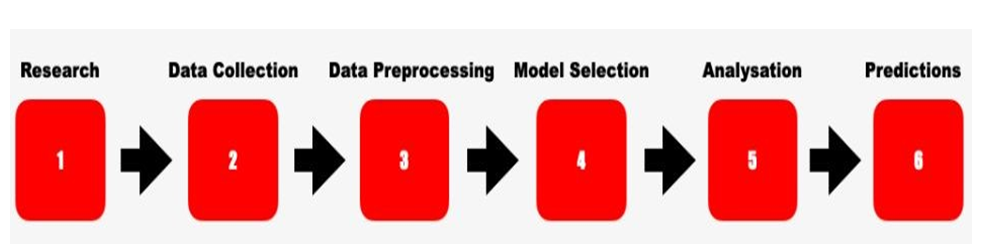
In this project, we will first collect and evaluate the dataset. We will transform the raw data into an accessible format and visualize it using data preprocessing. Various machine learning algorithms such as Linear regression, polynomial regression, SVM, holt’s linear model, Holt’s winter model, AR model, ARIMA model, and SARIMA model are used. The tools used in this project are mainly sklean for model selection, and NumPy library which is used to work with the arrays and pandas that use a key data structure called a data frame that allows us to store and manipulate tabular data in observation rows and variable columns, matplotlib is a library of plotting that is used to plot graphs. After implementing the model, the model with the least mean square error will be considered the best-fit model.
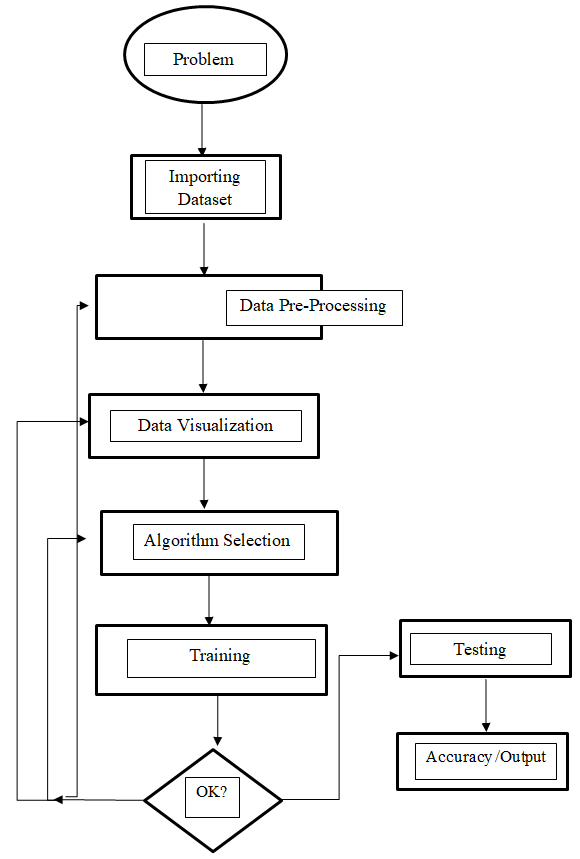
System Design
The dataset is first preprocessed and visualized so that it is in a usable format for analysis. After this, we model the data using Linear regression, polynomial regression, SVM, holt’s linear model, Holt’s winter model, AR model, ARIMA model, and SARIMA. Then we evaluate the model and choose the best one according to its root mean square.
The flowchart depicts the following
Dataset
The dataset involves the collection of data from various sources.
Data Pre-processing and visualization
In order to obtain accurate results, data preprocessing is done to check if there is any inconsistency in the data, if there is it is handled accordingly. We then visualize the data to study the pattern and trends in the data.
Model Building
Various models are used in this project-: Linear Regression
Polynomial Regression SVM
Holt’s Linear
Holt’s Winter Model
Auto Regressive Model (AR)
Moving Average Model (MA) ARIMA Model
SARIMA Model
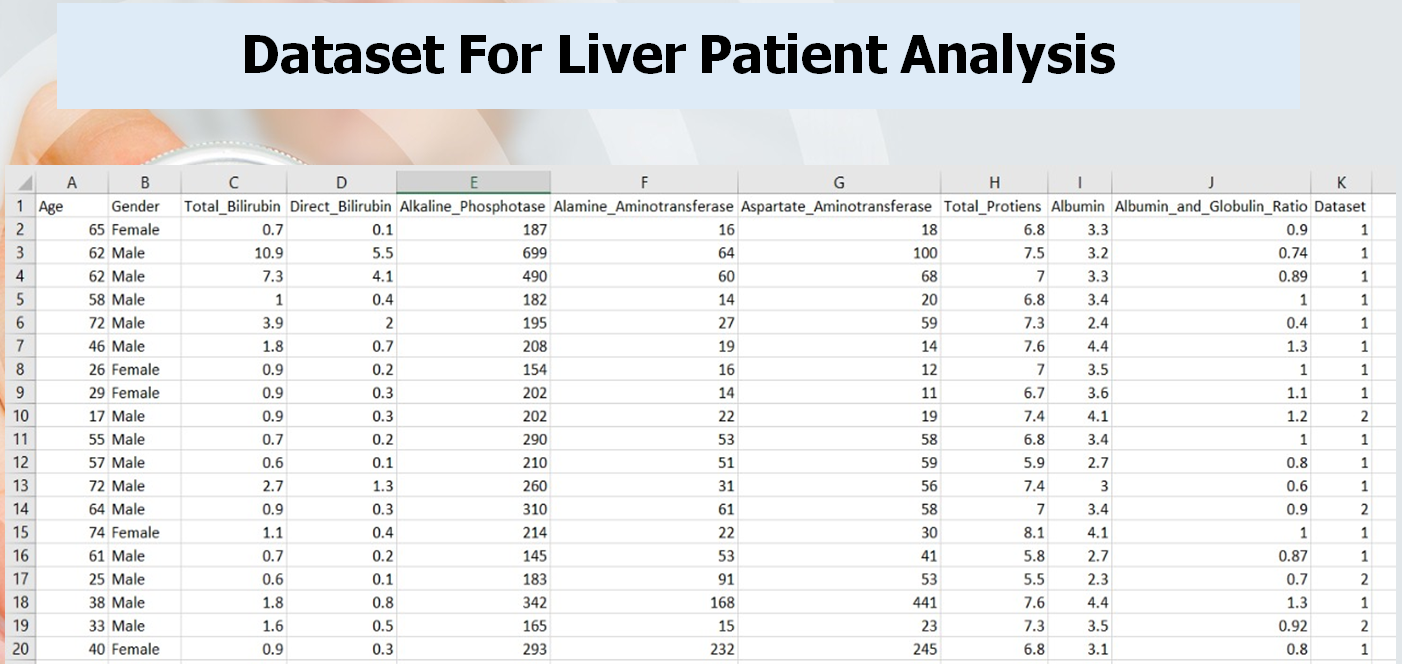
DATASET
In this project, the dataset is taken from Kaggle which is the Novel Corona Virus 2019 Dataset and the goal is to study the effect and spread of COVID-19 in the coming days, and conduct predictions and time series forecasting.
Hardware and Software Details
- Software Details Python 3.7(64-bit) Jupyter notebook
Implementation work details
First, the data is pre-processed and visualization is done and analyzed. Afterward, various models are used to train the data and the model with the least root mean squared error is selected as the best fit model. Various machine learning models are used and time series forecasting models such as holt’s linear model and ARIMA model are used. The dataset is obtained from Kaggle.
Real-life applications
It can be used by the government for predicting the extent of the spread of the infectious disease and take action accordingly.
Data implementation and program execution
The data is analyzed and visualized afterward. On different models, the data is trained and the one with the least mean square error is considered to be the best fit model and can be used for forecasting. The program is executed on a Jupyter notebook.
Output Screens
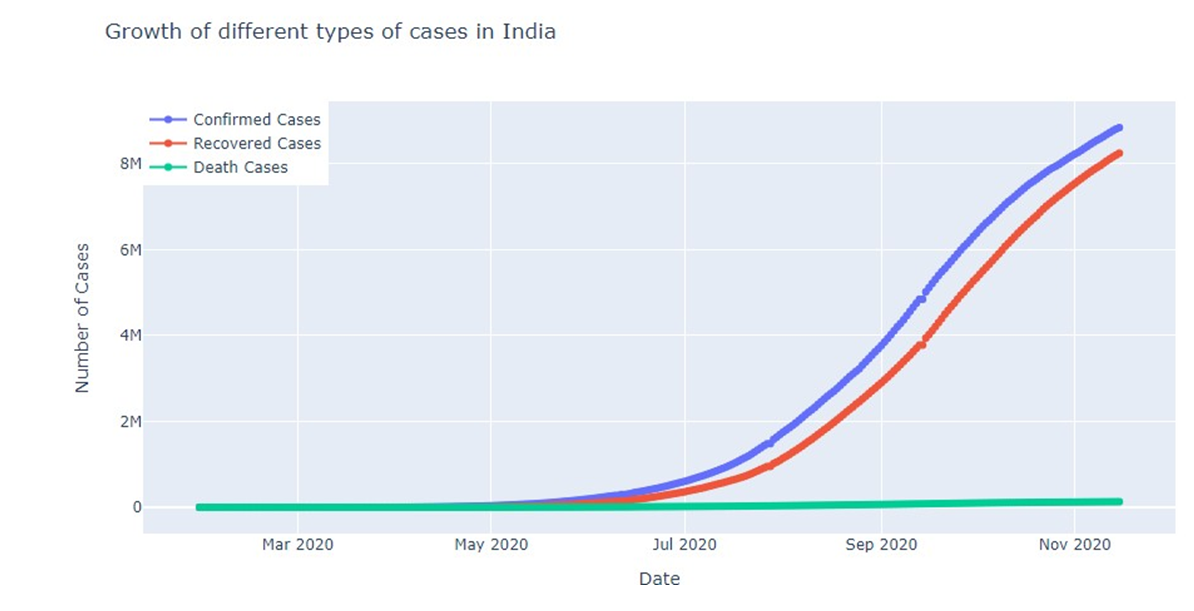
Fig: Growth of different types of cases in India
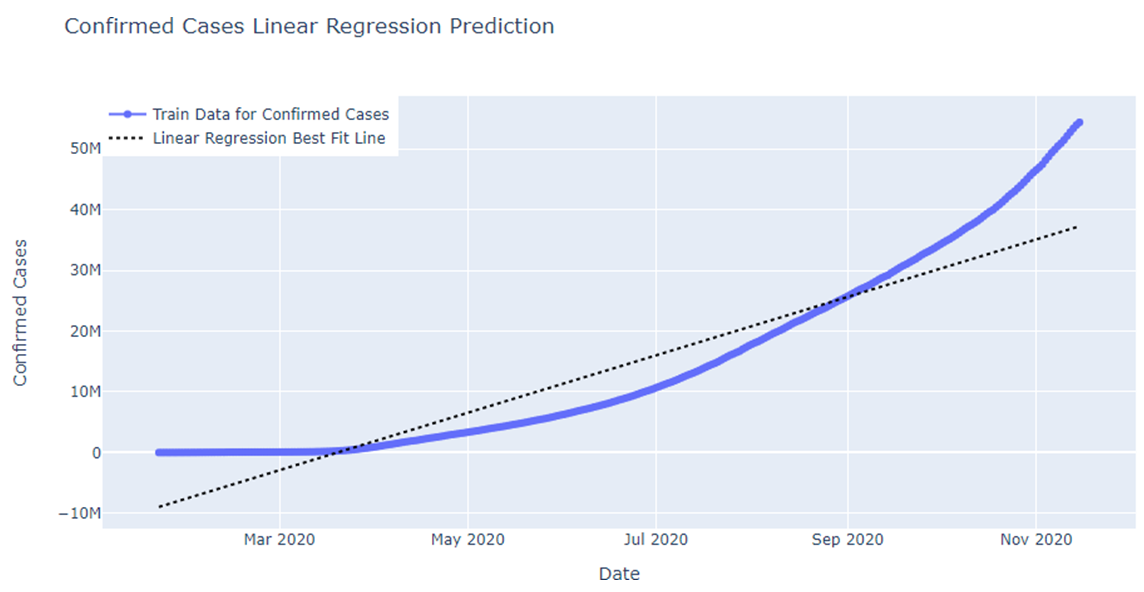
Fig: Confirmed cases Linear Regression Prediction
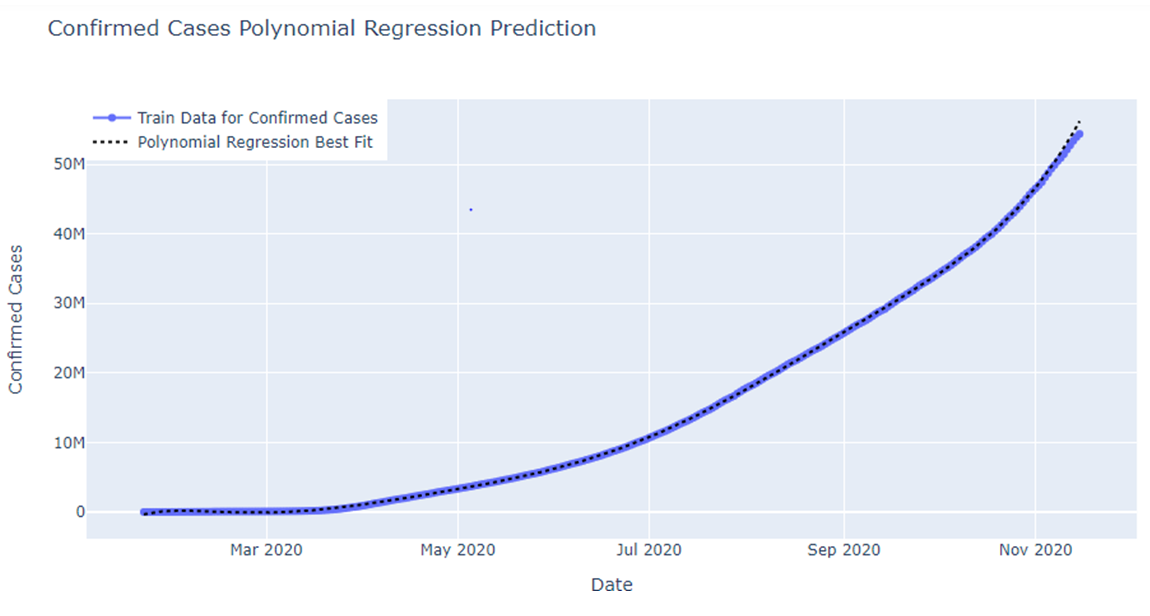
Fig: Polynomial Regression Prediction for confirmed cases
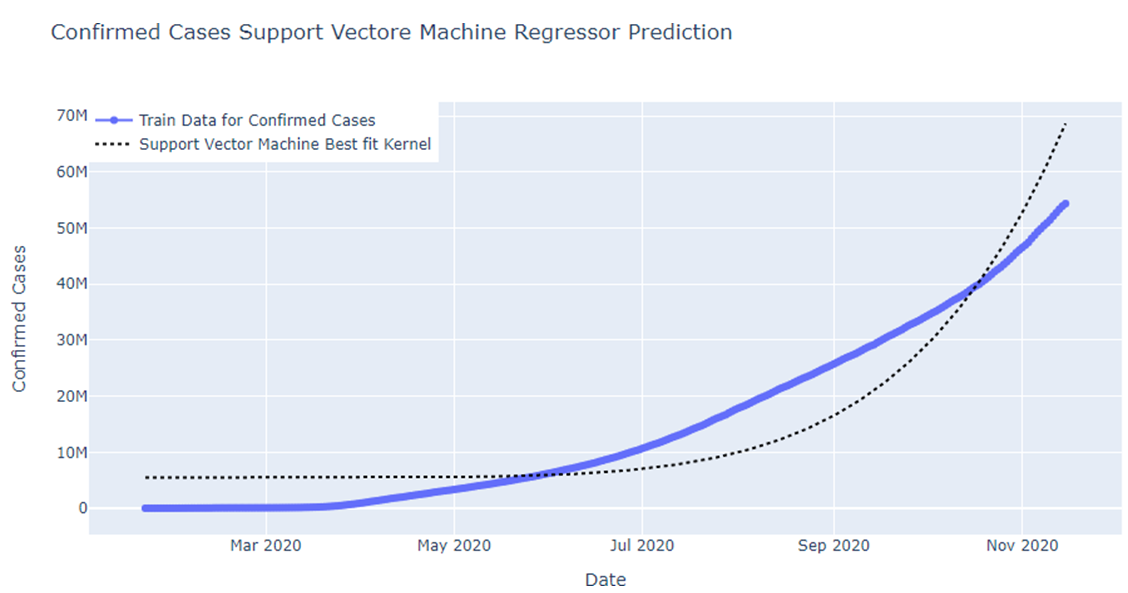
Fig: SVM regressor Prediction for confirmed cases
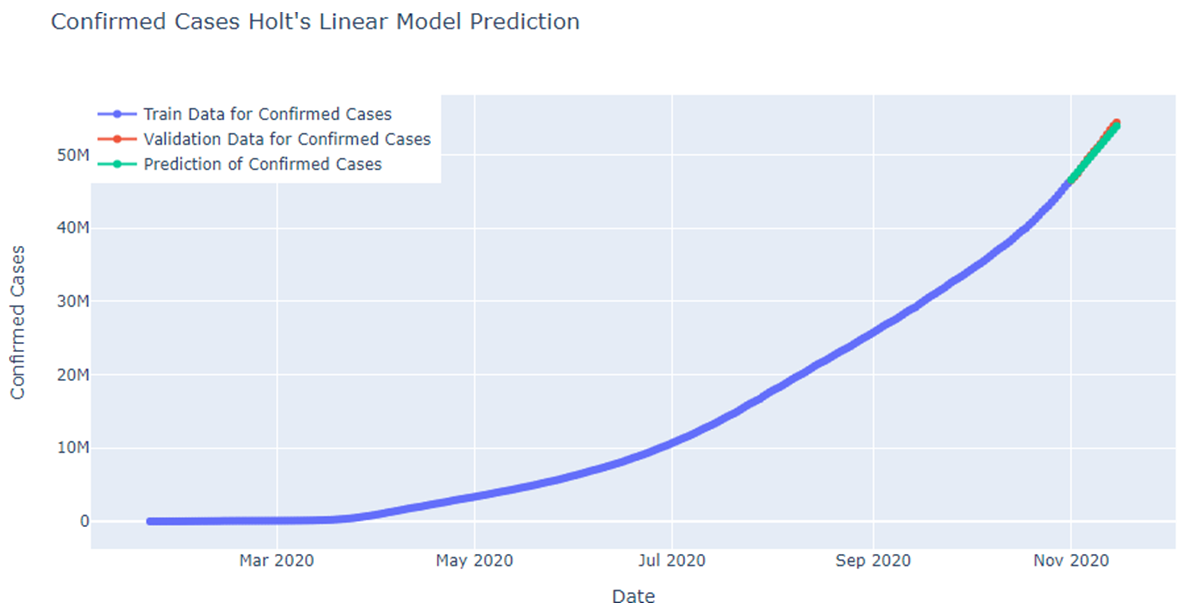
Fig: Holts Linear Model Prediction for confirmed cases
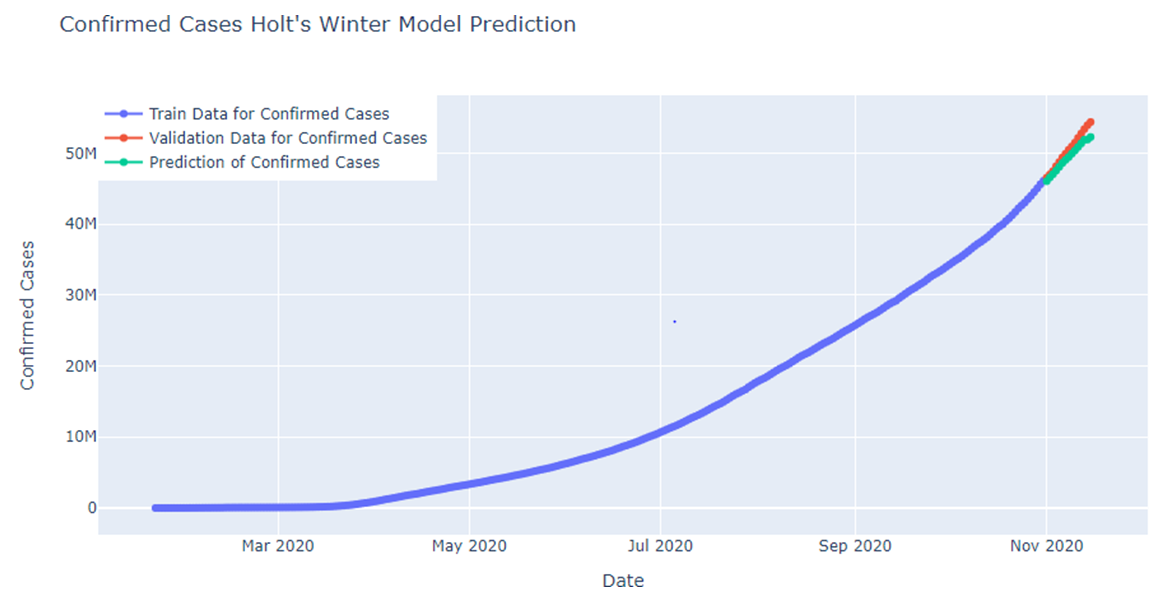
Fig: Holt’s Winter model prediction for confirmed cases
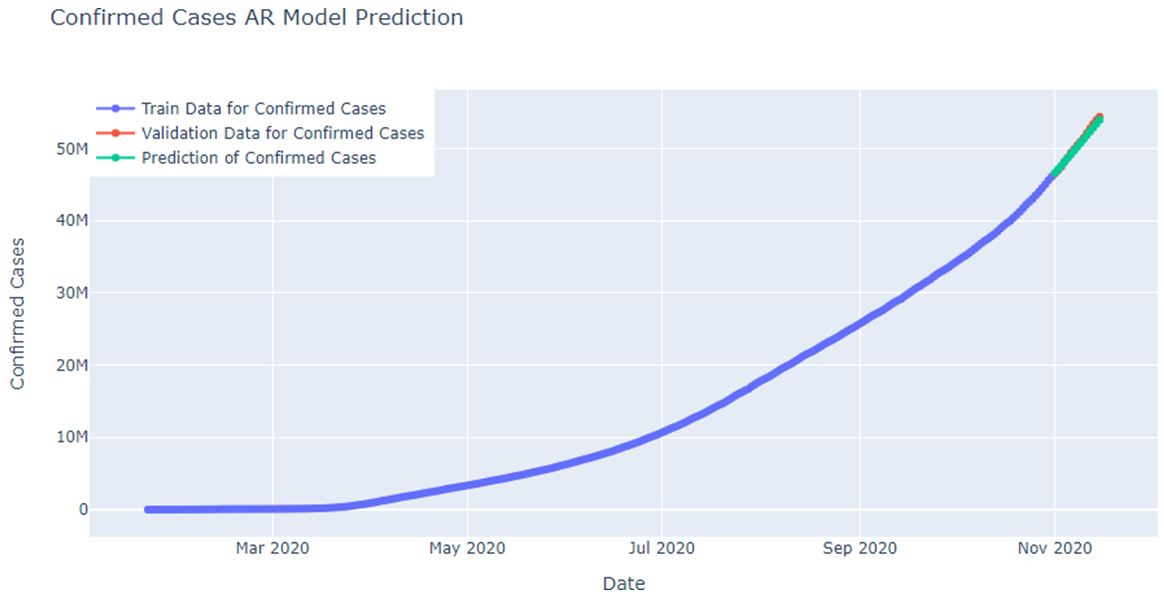
Fig: AR model prediction for confirmed cases

Fig: SARIMA model Prediction
System Testing
In this project, the model evaluation part is very important as by the means of it we can identify which model can best fit the problem.
Here the models are evaluated on the basis of their root mean square error(rmse).
The root-mean-square variance (RMSD) or root-mean-square error (RMSE) is a commonly used calculation of the differences expected by the model or estimator between values (sample or population values) and the values observed.
According to the rmse values of all the models tested in the project, the one with the least rmse value was the SARIMA model. So it can be considered the best fit model for this problem.
Conclusion
It is concluded that machine learning models can be used to forecast the spread of infectious diseases like Covid-19. In the project, we used various algorithms to forecast the rise of confirmed cases. It was observed among all the algorithms used, SARIMA had the least rmse so it was considered the best fit model for the data that was available.
Limitations
It is a new virus so only a year worth of dataset is available. Generally, the more data we have the better accuracy we get and we have to keep updating the data.
Scope for future work
It can be implemented such that it can update its graphs or predictions according to real-time values.
Download the Complete project on Covid-19 Outbreak Prediction Using Machine Learning Python Project Code & Report.