
Analysing E-Commerce Data Project Objectives
- Know fundamental concepts and can work on IBM Cognos Analytics.
- Gain a broad understanding of plotting different graphs.
- Able to create meaningful dashboards
Project Flow
- Users create multiple analysis graphs/charts.
- Using the analyzed chart creation of a Dashboard is done.
- Saving and Visualizing the final dashboard in the IBM Cognos Analytics.
- To accomplish this, we have to complete all the activities and tasks listed below
- Working with the Dataset
- Understand the Dataset
- Build a Data Module in Cognos Analytics.
Understand The Dataset
The data was sourced from the Kaggle.
Let’s understand the data of the file we’re working with i.e. US Superstore data.csv and give a brief
overview of what each feature represents or should represent
- Row ID – Unique ID for each entry.
- Order ID – Unique ID for each order.
- Order Date – Date on which the order was placed.
- Ship Date – Date on which the order was shipped.
- Ship Mode – Mode of shipping the order.
- Customer ID – Unique ID for each Customer.
- Customer Name – Name of the Customer.
- Segment – Segment to which the Customer belongs.
- Country – Country to which the Customer belongs.
- City – City to which the Customer belongs.
- State – State to which the Customer belongs.
- Postal Code – Postal Code of the Customer.
- Region – Region to which the Customer belongs.
- Product ID – Unique ID for each Product.
- Category – Category to which the product belongs.
- Sub-Category – Sub-Category to which the product belongs.
- Product Name – Name of the product.
- Sales – Sales fetched.
- Quantity – Quantity of the product sold.
- Discount – Discount Given.
- Profit – Profit fetched.
Build A Data Module In Cognos Analytics
In Cognos Analytics, a Data Module serves as a data repository. It can be used to import external data from files on-premise, data sources, and cloud data sources. Multiple data sources can be shaped, blended, cleansed, and joined together to create a custom, reusable and shareable data module for use in dashboards and reports.
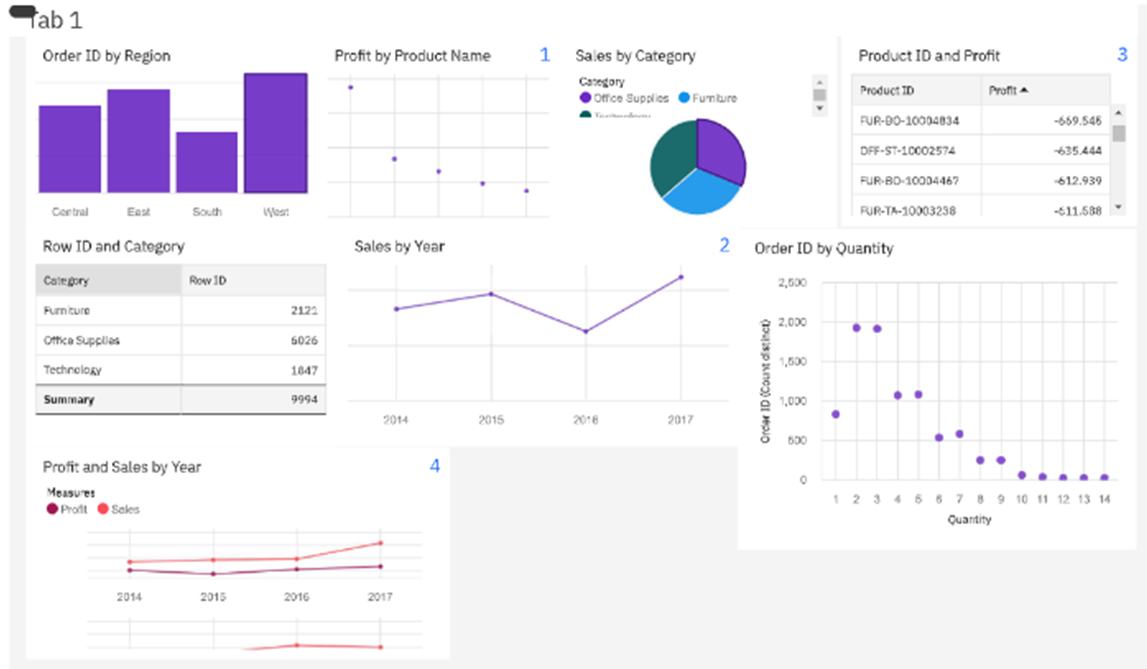
Visualization Of The Dataset
In Cognos, we can create different numbers of visualization and in the data exploration part we will be going to plot multiple data visualization graphs for getting the insights from our data and once the explorations are done we will build our dashboard.
Once you’ve loaded all the CSV files on the data module for creating different explorations.
RESULT
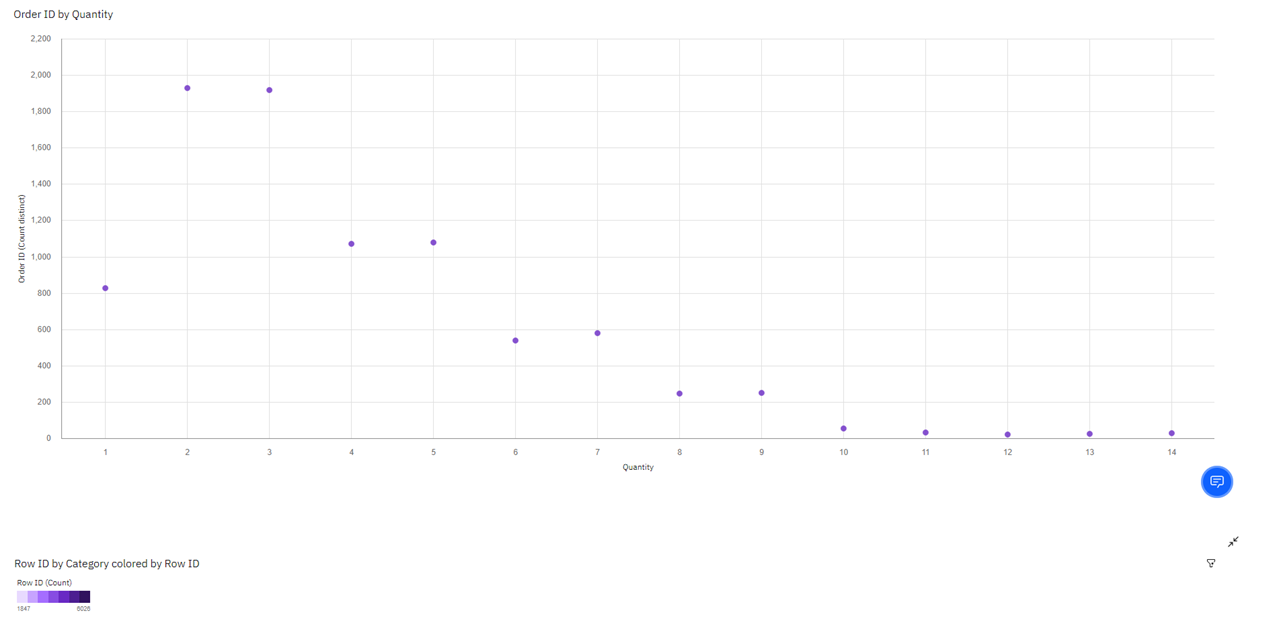
Order ID by Quantity:
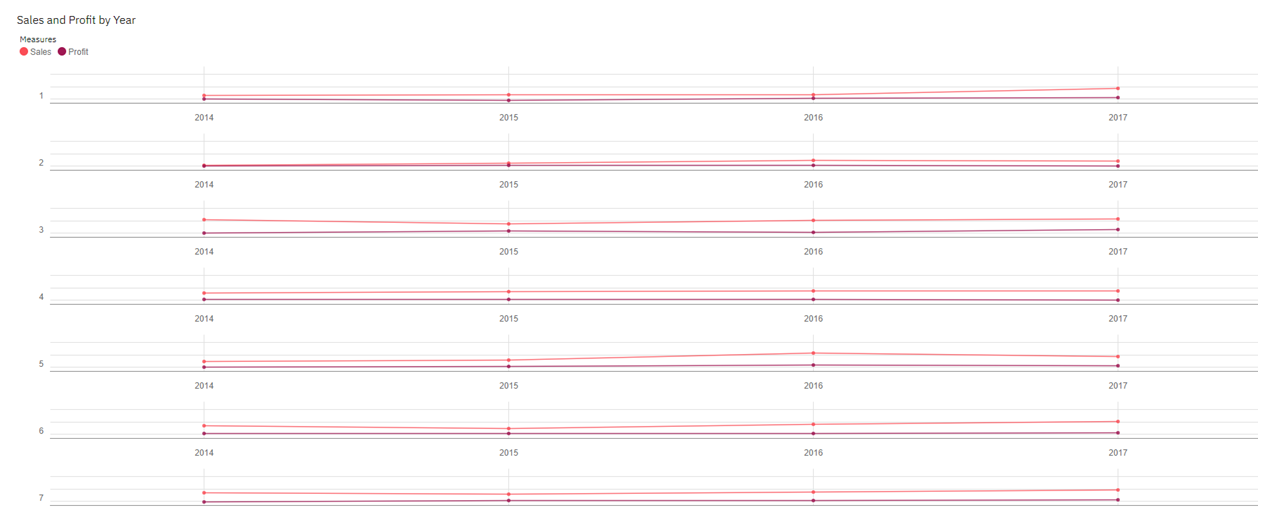
Sales and Profit by Year:
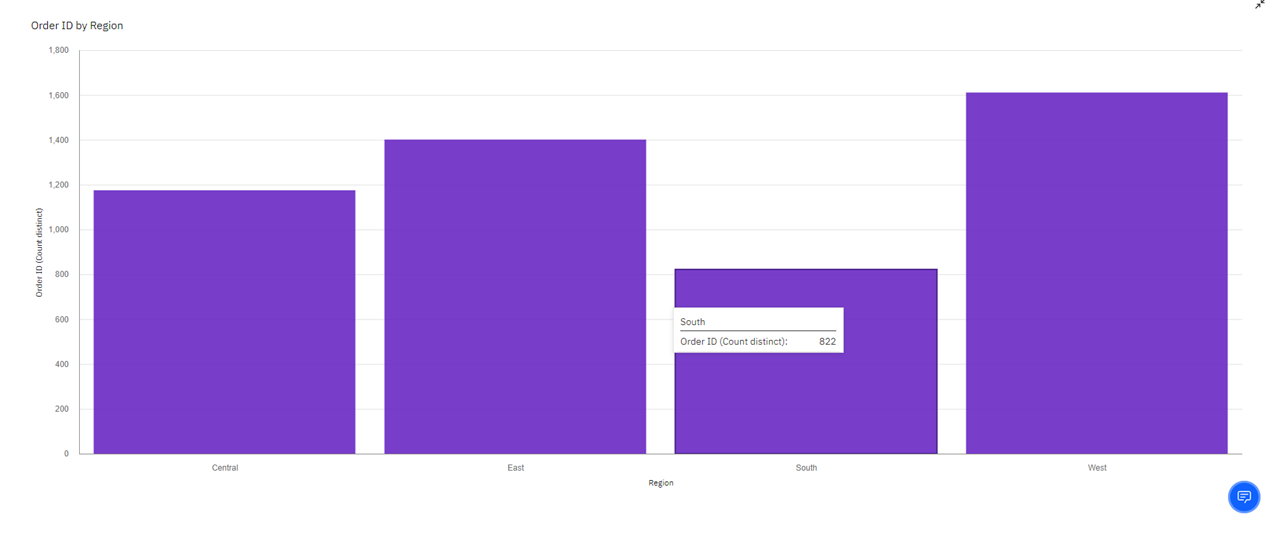
Analysing Region Wise E-Commerce Data
CONCLUSION
From this Analysing E-Commerce Data project, we have successfully:
- Created multiple analysis charts/graphs
- Used the analyzed chart creation of a dashboard
- Saved and visualized the final dashboard in the IBM Cognos Analytics