Automatic Video Surveillance System AI & IOT Project

Surveillance is an integral part of security. The main objective of the Video Surveillance system IoT project is to build an effective system that can be used across different domains and technologies. The system is used to Detect Human intervention and breach in personal or commercial property of the user in real-time using AI and IoT.

It helps users to secure their property with the help of advanced artificial intelligence. The resulting system is fast and accurate, thus helping users with more secure surveillance systems.

For the most part, the job entails looking out for something undesirable to happen. The application is to have a system that provides real-time monitoring and alert security when a human is detected in a user’s property in their absence.

OBJECTIVES:

The main objective is to build an effective Video Surveillance System that can be used across different domains and technologies. The system is used to detect people trying to breach security in the personal or commercial property of the user in real time and send a message along with a short video clip to the user. 

PURPOSE OF EXISTING SYSTEM:

Currently, the existing Rocker Bogie Suspension Systems Project or surveillance robot for defense Surveillance systems can keep video recordings of homes, offices, banks, and so on. But that is useful only after an incident or robbery happens. No Real-time Updates are provided when there is a breach in real-time. 

Just imagine, You’re at your home and someone breaks security and stole money or goods from your office or property. Or consider you’re out of town for some days and there is a robbery at your home. So after you come back home or someone identifies it after some time and they will update you about the breach at your place.

You can take any action after a breach has been done, not at the time it is being done. That issue will be resolved in our system with real-time monitoring and updates.

SCOPE OF SYSTEM:

The Video Surveillance System can be implemented in any residential, Industrial, or commercial property. The system recommends detecting any human intervention on the user’s property and sends a notification along with a threshold of a 10-second video clip immediately as soon as it detects humans.

PROBLEM DEFINITION:

This Video Surveillance System project aims to develop an advanced Surveillance system that can keep on monitoring homes, offices, banks, and so on. With the help of this, you can find out if anyone breaches your security in your absence. We have to simply integrate our system into users existing surveillance systems. 

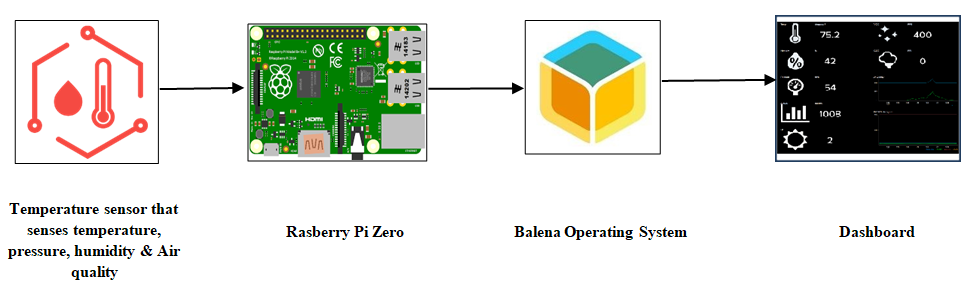
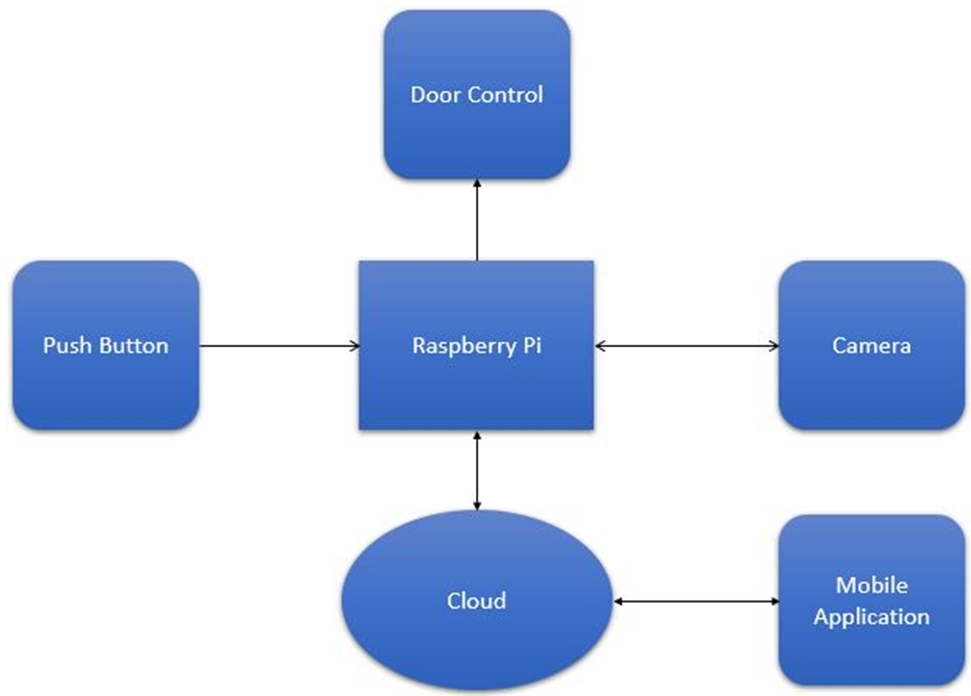
Module specification: 

  1. Raspberry pi
  2. Camera
  3. Server
  4. SNS
  5. S3  

Need Of Modules:

  • Raspberry pi as a Client to send frames to the server.
  • Camera to capture live video streams.
  • Server for processing frames and detecting humans.
  • SNS sends a multimedia message to a user when someone tries to breach security.
  • S3 to store a short video clip of the breach and send it to the user.

Non-Functional requirement.

EFFICIENCY REQUIREMENT :

When AI is taking care of your property then customers can relax and not have to worry about their security.

RELIABILITY REQUIREMENT :

 The system should provide a reliable environment for both the client and the server.

USABILITY REQUIREMENT :

The system is designed for a secure environment and ease of use.

IMPLEMENTATION REQUIREMENT :

Implementation of the system with pi, night vision camera, python, machine learning, and AI.

DELIVERY REQUIREMENT

The whole system is expected to be delivered in four months of time with a weekly evaluation by the project guide.

Limitations of the System:-

False Positives

Due to different light variant conditions and camera resolutions, sometimes the system detects humans as false when there is none but that can be neglected if there is a human and the system doesn’t detect it then there should be a problem.

Limited Processing Power

As we are using a microcontroller to send feeds to the server, it cannot handle multiple feeds at once and will be slower as the device increases.

Download Automatic Video Surveillance Management System Project Python Code, Documentation & report, Paper Presentation PPT

Temperature and Air Quality Monitoring System Project for Pet lovers

Introduction:

In this modern world, there are many pet lovers who would like to carry their pets to places wherever they go. It’s the responsibility of the same person to ensure the safety of their pets. There are some public places where they can’t take their pets. For example, if a person visits a shopping mall he can’t carry his pet into the shopping mall. Hence, he/she has to park his car in the parking lot, leave his pet inside the car, slide down the window a little bit for air circulation and continue his shopping.

For suppose he/she forgot to slide down the window and left for shopping then the pet gets suffocated due to lack of air circulation and a rise in temperature. Even though he/she slides down the window and leaves for shopping there is a possibility that one of the many people inside the parking lot may smoke a cigarette. The smoke released may enter the car and damage the air quality which in turn may have effects on pets.

This is where our project finds its scope. We are developing a “Temperature and Air quality monitoring system for Pet lovers” in which we are monitoring the temperature levels, humidity, pressure, and air quality of the air inside our automobile and present them in an attractive dashboard so that the pet owner can monitor the atmospheric conditions inside his automobile through all of his gadgets having internet connection.

High-level architecture of the project:

Hardware Requirements:

  • Raspberry Pi Zero
  • 32 GB or larger Micro–SD Card
  • Power Supply and cable
  • BME680 Sensor
  • Connecting cables

Software Requirements:

  • Balena Cloud to create dashboards using sensor data
  • Balena Etcher to flash our SD card
  • Balena CLI for command line interface
  • Balena Sense code for installing the services

Project Implementation:

Step-1:

  • The first step of our implementation is to flash the operating system is to flash balena operating system into our Raspberry pi zero board.
  • For this initially, we have to create a balena cloud
  • Once we signed up and login into our balena cloud account then we have to create an application as shown below with our Wifi SSID and password and then we have to download Balena operating system image
  • Once we download the operating system image file then we will insert our SD card into card reader and connect the card reader to our
  • Then we will flash the OS image file into an SD card by means of balena Etcher as shown
  • By end of this system, our SD card should be ready with the flashed operating system for insertion into our Raspberry Pi zero board.

Step-2:

  • The main aim of this step is to complete the hardware
  • Please find the pin configuration of the Raspberry Pi Zero
  • Please find the pin configuration of the BME680 sensor
  • The connections are listed below:

Pin1 of Raspberry Pi zero——- CC pin of BME680

Pin3 of Raspberry Pi zero—– SDA pin of BME680

Pin 5 of Raspberry Pi zero—– SCL pin of BME680

Pin 9 of Raspberry Pi zero—– GND pin of BME680

  • Once we complete the connections to the BME680 sensor then we have to insert the flashed SD card into the SD card slot of our Raspberry Pi Zero
  • Please find the Raspberry Pi zero board after the connections are done as below:

Step-3:

  • Once we completed step 2 then we have to power up our Raspberry Pi zero board and then we have to open balena
  • If everything goes right our device must automatically be listed in balena cloud as shown
  • Then we have to install Balena command line interface for pushing the services
  • Then we have to push balena sense code into our board by using push
  • Please find the balena CLI below:
  • Once the push is successful then automatically the services get installed as shown below:

Step-4:

  • When the above three steps are successful then our cloud starts pulling the data from the sensor
  • To see the readings in dashboards we need to enable the public device URL and we can copy the URL we can access the dashboards on any device on which a web browser is installed across any geographic location.
  • Please find the screenshot of the dashboards below:
  • Then for testing purposes, I started breathing on the sensor. As we all know human breath contains CO2 and it is warm we can see on the dashboards as Indoor Air Quality showing Unhealthy and temperature is also raised as
  • After I have stopped breathing on the sensor within some time the IAQ returned to Good and also we can see the temperature started dropping as
  • As I have mentioned earlier every individual having a public device URL can monitor the dashboards from any electronic device which has a web browser installed in it. Please find the dashboards opened from the mobile phone
  • Hence the device is placed in a car with wifi module connected to it our device starts sending the data to the cloud. Hence even though pet owners leave their pets in cars and left for shopping can monitor the temperature and air quality and can make sure their pet is safe.

Real-Time Map-Based Pollution Monitoring and Data Management System

Title : Real-Time Map-Based Pollution Monitoring And Data Management System

Introduction: For years, pollution has been a major issue faced by mankind and it is increasing by the day. The recent pollution disasters that happened in major cities across the globe have taught us one thing and that is, that it is important to keep an eye on the pollution that is increasing day by day. Many government and global organizations have started to work on it and almost a decade has passed since these programs have been functioning. But, the major issue with these organizations is that they are focused on beating pollution on every front whether it is air pollution or water pollution.

These organizations are more focused on amending laws for pollution control and the monitoring process boils down to analyzing air quality and then making changes in the environmental laws. Also, the issue is that these bodies are controlled by the central or federal government. But, pollution is no longer an issue that can be tackled gradually and conventionally. It needs immediate attention and effective monitoring is required so that the authorities can take necessary measures to solve the pollution problems.

The pollution problem is more persistent in urban metropolitans and metros. But, municipal corporations have very little control over the situation because of a lack of data to act upon. Recent developments in the smart city sector are also encouraging cities to develop monitoring systems. The city of Ahmedabad, Gujarat has implemented digital signboards that show the real-time value of major air pollutants and overall air quality. This data is displayed to the people driving on the road so that they can take necessary precautions to avoid or minimize the health risks due to pollution. But, this kind of Pollution Monitoring project requires a huge amount of funds and is also not feasible everywhere.

So we are building a minimalistic model to tackle the issue of monitoring pollution. Our main goal is to provide real-time data visualization and also provide a database that will store all the data and provide readings of various pollutants. The data will be visualized through the means of a map hence it would be easy to pinpoint the exact location when any kind of action is needed. We will also build a device to capture data and then feed it into a web application that can be used to monitor and visualize the data.

The main aim of this Real-Time Map-Based Pollution Monitoring project is to provide a centralized repository of sensor data and also to create an effective and centralized monitoring system. The low cost and feasibility of the project make it easy to use for both smart cities as well as small towns. Furthermore, this kind of monitoring system will allow for the development of effective countermeasures and control strategies for keeping the pollution problem in check.

Process Flow:

Pollution Monitoring System Process Flow

Methodology

Methodology

This Real-Time Map-Based Pollution Monitoring project is aimed at local authorities like the municipal corporation rather than the central government so that immediate action can be taken by them to control the pollution problem.

This Pollution Monitoring project can be briefly divided into three main parts:-

  • Data Collection.
  • Data Monitoring.
  • Data Storage.

1. Data Collection:

Data collection is an important part of this Pollution Monitoring System project. Any kind of monitoring system is functional only because of the data that has been provided to it.

Data collection will be consisting of reading data from sensors. Now, from the research conducted, we have been able to deduce the major kind of data that we need. Looking at the urban pollutants we have observed that the most prominent pollutant is the Particulate Matter (PM) and Suspended Particulate Matter (SPM).

Hence we have decided to use a DSM501A Particulate Matter and Suspended Particulate Matter Sensor for detecting PM(2.5) or Particulate Matter, which is one of the major pollutants. Also, it leads to various lung and carcinogenic diseases and skin problems.

Particulate Matter concentrations have raised dramatically in the past decades to increase the number of automobiles on urban roads. Hence we have decided that monitoring PM/SPM (Particulate Matter and Suspended Particulate Matter) is going to be one of the main agendas of our monitoring system.

Another major pollutant that has been identified is Carbon Monoxide (CO). Now, CO is not just a single pollutant but, it is also responsible for creating another harmful pollutant i.e Ozone (O3). Ozone is important for blocking UVs from the sun but, at the ground level, the Ozone is a dangerous gas. Carbon Monoxide is specifically dangerous as it affects the hemoglobin if the concentrations exceed 35 ppm (parts-per-million).

From the research we have done, it has been clear that CO is present in spatial quantities but, that means that we need to effectively monitor it to keep its concentrations at safe levels. We will be using an MQ-7 sensor for measuring Carbon Monoxide.

Studies have pointed out that SO2 and NO2 are also major air pollutants and contribute to the degradation of overall air quality. Also, several hydro-carbon compounds are pollutants although not major, affecting the air quality a lot. Hence we have decided to use an MQ-135 sensor to monitor SO2 and NO2 levels as well as the overall air quality.

The sensors will be interfaced on a Raspberry Pi and their data will record using the GPIO library (Python). The data from these sensors will then be directed to the web server and the storage.

2. Data Monitoring:

Data Monitoring is the key component of the system. To monitor the data we have decided to use Google Maps so that the position of our Raspberry Pi Module can be pinpointed and then by using color-coding we can determine the levels of pollution in the vicinity of our Raspberry Pi Module.

All of this will be achieved by creating a web server in Python using the Flask framework and the main desktop app will be a web application written in HTML, CSS, Bootstrap, and JavaScript. The desktop app will have three options

  1. Map-Based Monitoring
  2. Individual Pollutant Monitoring
  3. Statistics

3. Data Storage:

Data Storage is necessary to reference past data and develop statistics from them. The data will be stored locally on the file system and can be downloaded in the form of excel sheets.

Timeline 

Serial Number

Tasks

Duration

1.

Synopsis and Presentation Submission

15 days

2.

Component Purchasing and Testing

15 Days

3.

Interfacing sensors and writing server script

15 days

4.

Writing Front-End Application

15 days

5.

Integrating Front-End and Back-End services

15 days

Components

  • Raspberry Pi model B
  • SD card and adapter
  • MQ-7 sensor
  • MQ-135
  • DSM501A


Raspberry Pi Project on Intelligent Door Access Management System

Today the world has been far more advanced in technology than in the last 3 decades and with that, there are advances in the technologies that help to keep our homes safe. With the help of IoT now we can track our house even when we are on vacation.

The significance and the purpose of our Door Access Management System are to make the user’s home much safer by increasing security and giving the user full control of the system.

Introduction

Background of Project

When we are at work, we may have an important meeting and may not be in time to receive our guests and they may need to wait outside. The same may happen if we are on a vacation and to safeguard ourselves from Intruders.

The duty of an Engineer is to provide solutions for the problems faced every day with upcoming technologies and we have come up with a model which will help to solve them.

Statement of the problem

This project will create a smart doorbell messaging system so that when a guest clicks on the button, obtains an image of the user via a camera peripheral, uploads the image and event data to a Googles Firebase cloud, and sends a message with some message to notify that a guest has arrived.

Aims and Objectives of the project

The main objective of the project is to make a Smart door system. The other objectives are: –

  • To include an access button to allow the user to open/close the door

Materials

The main components of the Intelligent Door Access Management System are as follows:

  • Raspberry pi 3    
  • Push-button 
  • Logitech Camera                                                     
  • Stepper motor

Working

The first step was to make an interface between the Push button and the Camera using Raspberry Pi so that when the button was pressed the camera would take a picture. The next step is to connect the camera to the Firebase Cloud to upload the images in the Firebase Storage and send the image’s URL to the Firebase Database.

Next using Android Studio, a Mobile application was designed to retrieve the image from the Firebase Database. Using Node JS push messaging is also added along with the mobile app such that when someone is at the door a notification pops out. They can Open or Close the door using the buttons in the app. When pressed the data is sent to Firebase Database and retrieved by the Raspberry Pi which then operates the door.

Flow Diagram

Block Diagram of Door Access System

Bill of Materials:

Materials

Cost (in Rs.)

Logitech camera

1350

Raspberry Pi 3B

3500

Micro-Stepper motor

400

Push Button

50

Contingency

700

Total

6000


Future scope

  • Face recognition can be implemented to allow family members /regular guests
  • It can be integrated with a burglar alarm and inform the police of intruders 

Conclusion

The project “Intelligent Door Access Management System” has been tested real-world scenario and the door is opened or closed by the commands given by the user