This project “Fake Disaster Tweet Detection” aims to help predict, whether a tweet weather it is fake or real. It uses the Multinomial Naïve Bayes approach for detecting fake or real tweets from existing datasets available on Kaggle. The classifier will be trained only on text data. Traditionally text analysis is performed using Natural Language Processing also known as NLP. Natural language processing is a field that comes under Artificial Intelligence. Its main focus is on letting computers understand human language and process it. NLP helps recognize and predict diseases using speech, it helps in sentiment analysis, cognitive assistant, spam detection, the healthcare industry, etc. In this project Training Data is pre-processed, then sent to the classifier, then and the classifier predicts weather the tweet is real or fake.
This project is made on Jupyter Notebook which is a part of Anaconda Navigator. This project ran successfully on Jupyter Notebook. The dataset was successfully loaded into the notebook. All the extra python packages which were required for project completion were also loaded into the notebook. The model is also deployed successfully using HTML, CSS, python, and flask.
The accuracy score on test data is 77.977%. average recall value is 0.775 and the average precision score is 0.775. Precision is used to calculate a number of correct positive predictions made by the model. The recall is used to calculate the number of correct positive predictions made out of all the positive predictions that could have been made.
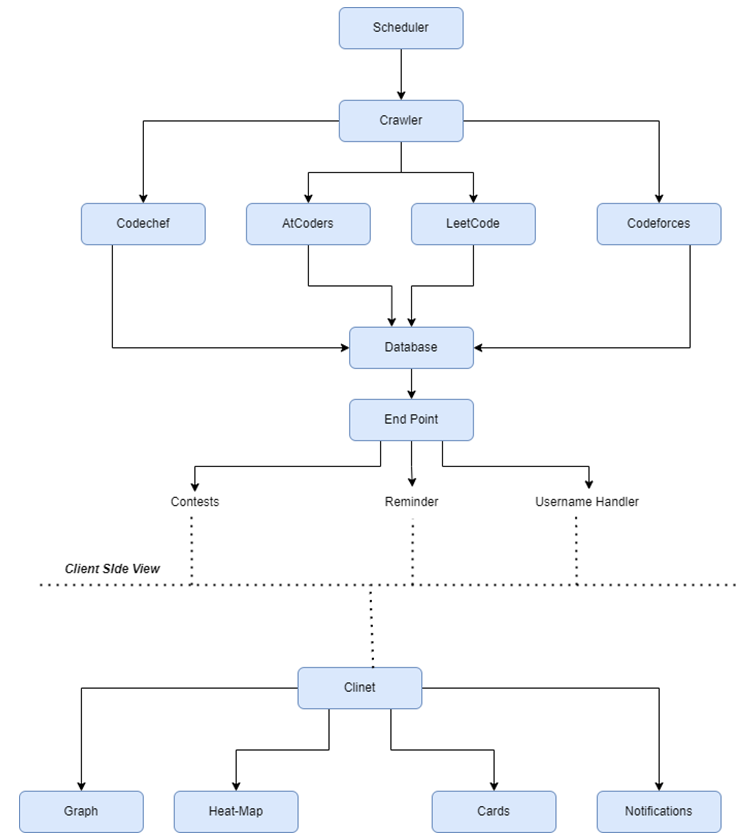
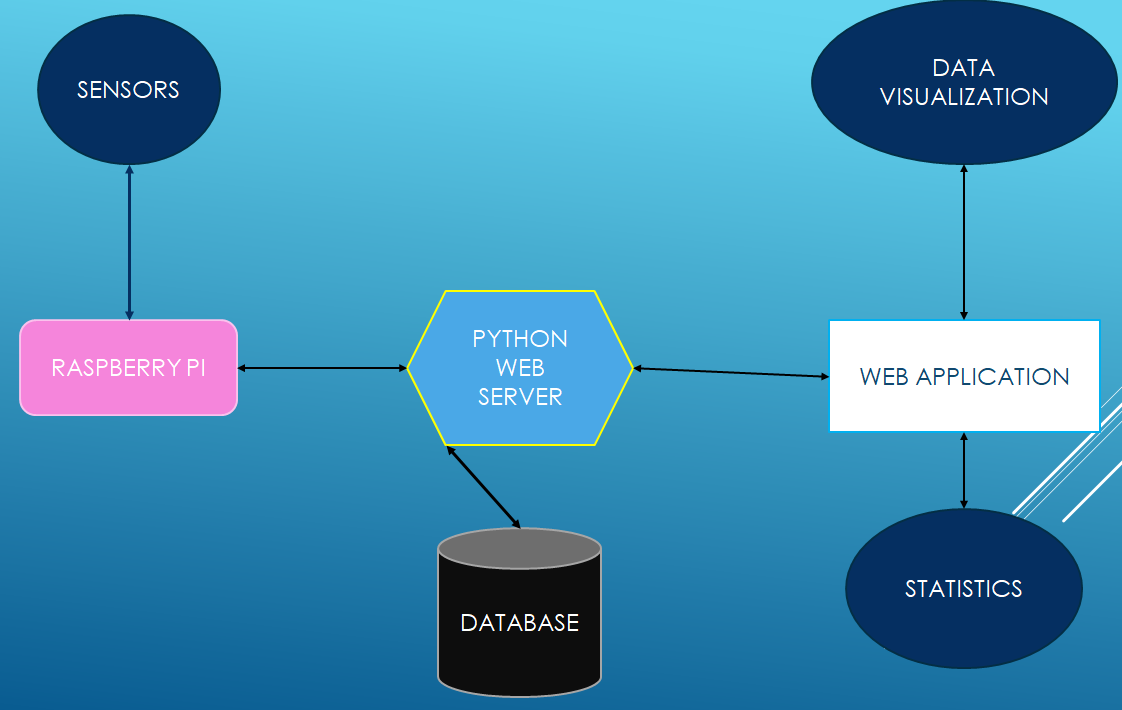
System Design
System Flowchart

System Flowchart
Problem: To detect disaster tweets whether it’s fake or real using a machine learning algorithm. In this, the concept of Natural language Processing is used.
Identification of data: In this project, I have used a dataset available on Kaggle competition based on Natural language processing. This project works only on text data. It has five columns:
- Id: It tells the unique identification of each tweet
- Text: It tells the tweet in text form
- Location: It tells the place from where the tweet was sent and it can be blank
- Keyword: It tells a particular word in the tweet and it can be blank
- Target: It tells the actual value of the tweet weather it’s a real tweet or Fake
Data-preprocessing: First the preprocessing is done in the dataset which includes the removal of punctuations, then the removal of URLs, digits, non-alphabets, and contractions, then tokenization and removing Stopwords, and removing Unicode. Then lemmatization is done on the dataset. After preprocessing Countvectorizer is used to convert text data into numerical data as the classifier only works for numerical data. The dataset is then split into 70% training data and 30% test data.
Definition of Training Data: The training dataset which contains 70% of the whole dataset is used for training the model.
Algorithm Section: In this project Multinomial Naïve Bayes classifier algorithm is used for detecting disaster tweets whether they are fake or real.
Evaluation with test set: Several text samples are passed through the model to check whether the classification algorithm gives the correct result or not.
Prediction Model

Implementation Work Details
The data-set which is used in this project “Fake disaster tweet detection” is taken from the Kaggle competition “Natural Language Processing with Disaster Tweets”. The data set contains 7613 samples. This project works only on text data. It has five columns:
- Id: It tells the unique identification of each tweet
- Text: It tells the tweet in text form
- Location: It tells the place from where the tweet was sent and it can be blank
- Keyword: It tells a particular word in the tweet and it can be blank
- Target: It tells the actual value of the tweet weather it’s a real tweet
Step 2: Data-Preprocessing
- Removing Punctuations: Punctuations are removed with the help of the following python code
- Removing URLs, digits, non-alphabets, _: True means it has HTTP, and False means it does not have HTTP
- Removing Contraction: It expands the words which are written in short form like can’t is expanded into cannot, I’ll is expanded into I will, etc.
- Lowercase the text, tokenize them, and remove Stopwords: Tokenizing means splitting the text into a list of tokens. Stopwords are the words in the text which does not provide additional meaning to the text.
- Lemmatizing: It converts any word into its root form like running, ran into a run.
- Countvectorizer:
Text cannot be used to train our model, it has to be converted into numbers that our computer can understand, so far in this project, Countvectorizer is used. Countvectorizer counts the number of times each word appears in a document. Countvectorizer works as:
Step1: It first identifies unique words in the complete dataset.
Step 2: then it will create an array of zeros for each sample of the same length as above Step 3: It then takes each word at a time and find its occurrence in each sample in the dataset. The number of times the word appears in the sample will replace the zero positioned at the word in the list. This will repeat for every word.
Step 3: Model Used:
In this project, the Multinomial Naïve Bayes approach is used for detecting fake or real tweets from existing datasets available on Kaggle. Naïve Bayes classifier is based on the probability theorem “Bayes Theorem” and also has an assumption of conditional independence among every pair.

System Testing
This project is made on Jupyter Notebook which is a part of Anaconda Navigator. This project ran successfully on Jupyter Notebook. The dataset was successfully loaded into the notebook. All the extra python packages which were required for project completion were also loaded into the notebook. The model is also deployed successfully using HTML, CSS, python, and flask.
The machine learning model is evaluated we normally use classification accuracy which is the number of correct predictions divided by the total number of predictions.
This accuracy measuring technique works well when there is an equal number of samples in the dataset belonging to each class. The accuracy score on test data is 77.977%. average recall value is 0.775 and the average precision score is 0.775. Precision is used to calculate a number of correct positive predictions made by the model. The recall is used to calculate the number of correct positive predictions made out of all the positive predictions that could have been made.
- Precision = True Positives / (True Positives + False Positives)
- Recall = True Positives / (True Positives + False Negatives)
Conclusion
In this project only one classification algorithm is used which is Multinomial Naïve Bayes. First, the preprocessing is done in the dataset which includes the removal of punctuations, then removal of URLs, digits, non-alphabets, and contractions, then tokenization and removing Stopwords, and removing Unicode. Then lemmatization is done on the dataset. After preprocessing Countvectorizer is used to convert text data into numerical data as the classifier only works for numerical data. The dataset is then split into 70% training data and 30% test data. The accuracy score on test data is 77.977%. average recall value is 0.775 and the average f1 score is 0.775.
Future Scope
In the future, some other classification algorithms can also be tried on this dataset like KNN, Support vector machine (SVM), Logistic Regression, and even Deep learning algorithms can also be used which give very high accuracy. Vectorizing can be done using other methods like word2vec, Tf-Idf vectorizer, etc.
Download the Complete Project on ake Disaster Tweet Detection Web Application Python-based Machine Learning Project.