Sequence diagram
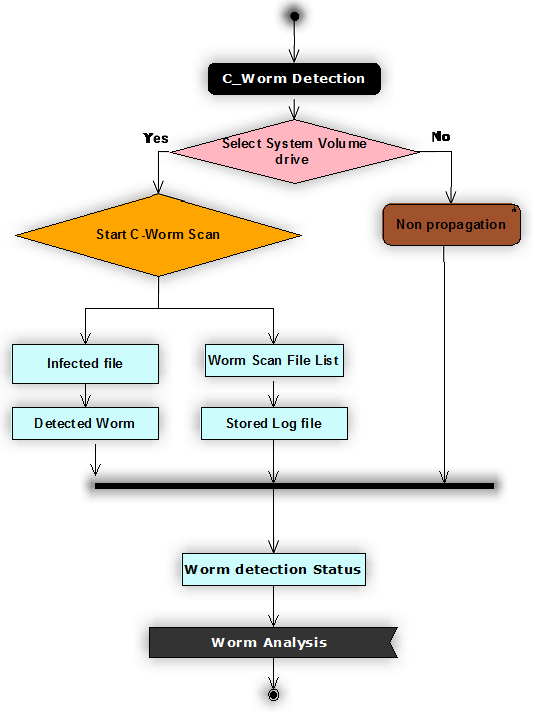
In general the sequence diagram represents the sequence of operations used across the design and the corresponding sequence diagram for this application is as shown below
The sequence of operations used across this design are shown in the form of sequence diagram as shown above and from the above diagram it is clear that the actual operations beings with scanning the desired drive for C-worms. As discussed the scanning of the worms can be done in different ways like selecting all the desired drives, selecting the user home drive, selecting the desired file or folder and this option is done based on the user choice.
Once the desired destination of C-worm scan is selected then the very next step is to choose the type of scan to be implemented and for this purpose, if the user select the desired destination for scan, then automatically the C-worm scan is initiated and if not a normal propagation scan to the complete system is initiated.
C-Worm detection can be categorized in to different aspects and the key operations include detecting the infected file and maintaining the list of worm files. Once the infected files are detected they are maintained in a separate list and the corresponding log files are maintained. The key information provided in the files includes complete folder and drive where the infected file is detected and the level of changes done to the file are also maintained across these log files. Two types of log files are maintained across the C-worm detection process and they are normal log and the stored log.
Normal log holds the high level details of the infected files and the stored log file maintains the exact details of the infected files and more accurate details of the worm detected in the scanning process. Once the log file are created , they can be used for future use to track the similar type of attacks in the system and a detailed analysis on the status of the worms can be tracked at any point of time using this design and this will be the last operation in the sequence of applications.
Complete worm analysis is done to track the status of the scanning operation and the status can be displayed to the user in the form of a graph and this graph is shown with respect to the detection time and detection rate of the scanning process against the number of attacks done by the C-worms on the overall system being scanned.

