
Management Insights Dashboard Assignment
The leaders of a company want to develop Comparing Dashboards for the management of the organization. These dashboards will provide a transparent and dynamic representation of the organization’s most important metrics, such as Revenue, Costs, and Profits, which can then be used for additional analysis or decision-making.
Data Model:
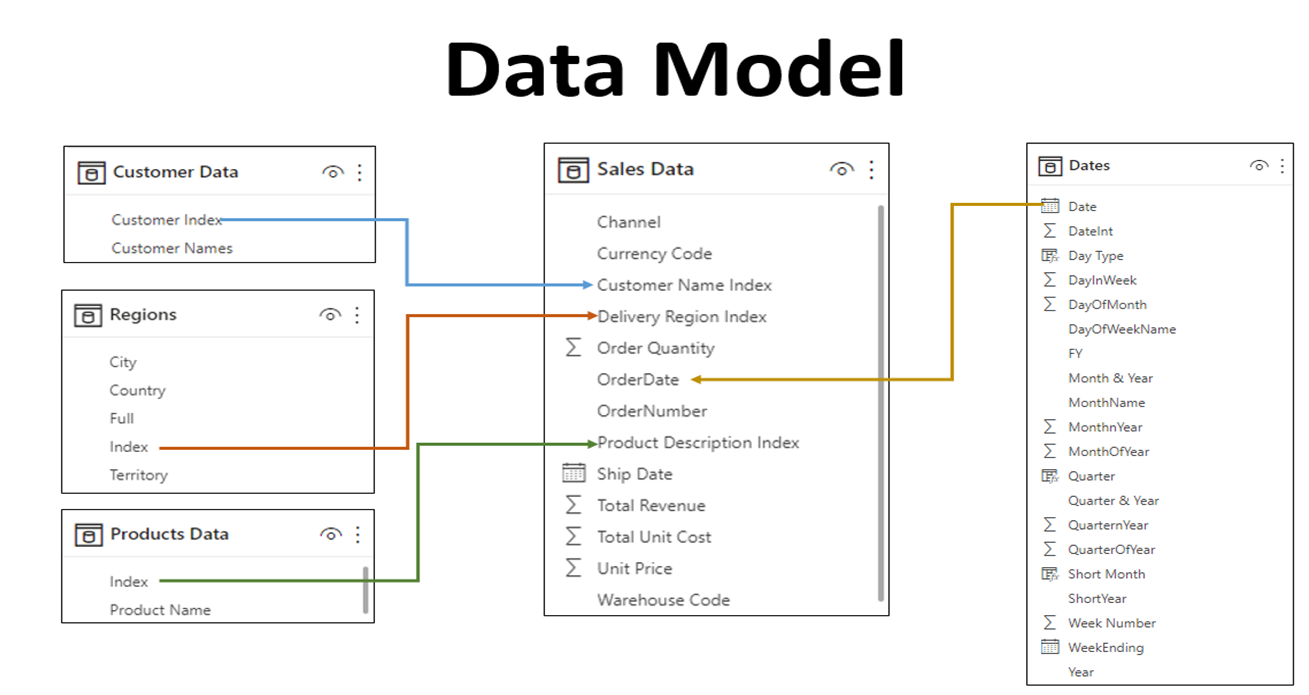
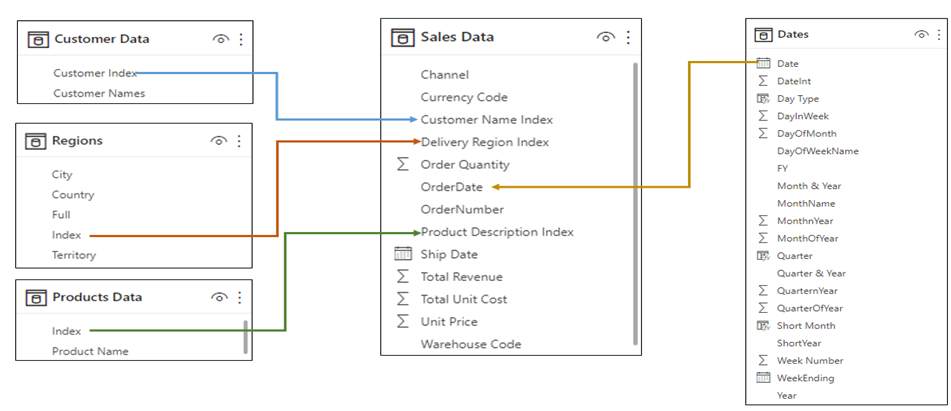
The management team at the company supplies the information in the excel file titled “Management_Insights_DataModel.xlsx” and the corresponding data diagram can be viewed below. This Excel spreadsheet includes separate sheets for “Sales Data”, “Customer Data”, “Products Data”, and “Regions” data.
Both the “Sales Data” table and the “Customer Data” table can be connected via the “Customer Name Index” column and the “Customer Index” column, respectively.
Both the “Sales Data” table and the “Products Data” table can be connected via the “Product Description Index” column and the “Index” column, respectively.
Both the “Sales Data” table and the “Regions” table can be connected via the “Product Description Index” column and the “Index” column, respectively.
Both the “Sales Data” table and the “Dates” table can be connected via the “OrderDate” column and the “Date” column, respectively.
Business Requirement:
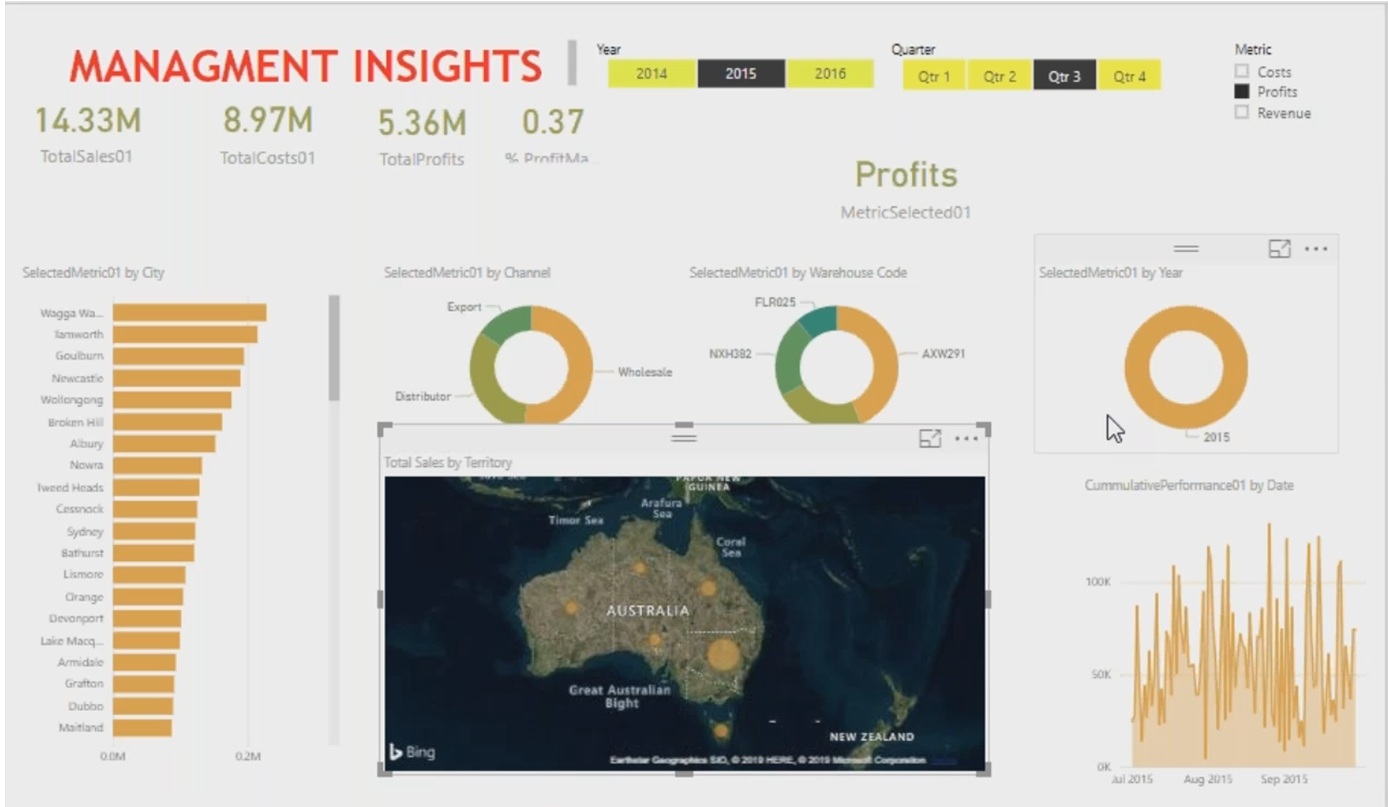
The executives of a company have requested that we develop an interactive and lively dashboard similar to the one seen below.
When the Year / Quarter of the selected Key Metric is clicked, the relevant data visualization should load up in order to facilitate improved decision-making.
Example Report:
Functional Requirements:
Data Gathering / Requirement:
Prepare a report using a variety of visuals in order to display management insights on a single page as effectively as possible. Feel free to use your imagination to create the most accurate representation of the facts you have.
- Sales Data
- Customer Data
- Product Data
- Regions
- Dates
Task 1.1
Create a mechanism that will load all of the tables from the “Management_Insights_DataModel.xlsx” into a respective table.
Task 1.2
In order to give the data segregation, you should first create a new table called “Metric Selection” and then fill in the information that is listed below.
Table Name: Metric Selection
|
Metric |
Metric Index |
|
Revenue |
1 |
|
Costs |
2 |
|
Profits |
3 |
2. Data Modeling:
Task 2.1
Establish the relationships between all of the tables that were uploaded from Excel as defined in the data model.
- DAX Calculations & Visualizations :
Task 3.1
Total Sales: Calculate a new measure in the “Sales Data” table, by summing the “Total Revenue” column and displaying it on the Power BI Visual “Card” on the Report.
Total Cost: Calculate a new measure in the “Sales Data” table, by multiplying the “Order Quantity” with “Total Unit Cost” and displaying it on the Power BI Visual “Card” on the Report.
Total Profits: Calculate a new measure in the “Sales Data” table, by using the previously created measures Total Revenue – Total Cost and display it on the Power BI Visual “Card” on the Report.
Profit Margin%: Calculate a new measure in the “Sales Data” table, by using the previously created measures that “Total Profit” % “Total Sales” and display it on the Power BI Visual “Card” on the Report.
Task 3.2
Create a new Power BI Visual Slicer – “Year” on the report using the Year column from “Dates” Tables to select year information. Connect all of the previously constructed “Total Sales,” “Total Cost,” and “Total Profits,” as well as the “Profit Margin%,” to this “Year” selection. Changing the criteria in the selection of this Metric Values, the corresponding information should be displayed.
Power BI Visual Slicer – “Year”, should show the buttons for the user to selection
Button background color should be changed on Click of a button
Task 3.3
Create a new Power BI Visual Slicer – “Quarter” on the report using the Quarter column from “Dates” Tables to select Quarter information. Connect all of the previously constructed “Total Sales,” “Total Cost,” and “Total Profits,” as well as the “Profit Margin%,” to this “Year” selection. Changing the criteria in the selection of this Metric Values, the corresponding information should be displayed.
Power BI Visual Slicer – “Quarter”, should show the buttons for the user to selection
Button background color should be changed on Click of a button
Task 3.5
Create a new Measure “MetricSelection” on the “Metric Selection” table. The “Metric Selection” table should be displayed on the Power BI Visual “Slicer” “Metric” on the report.
Power BI Visual Slicer – “Metric”, should show the check box for the user to select
Task 3.6
Create a new Power BI Visual “Clustered Bar Chart” on the report using city-wise data from sales data tables and connect this with “Metric”, “Year” & “Quarter” report components. Changing the criteria in the selection of this Metric/Year/Quarter the corresponding information should be displayed.
X-Axis – City
Y Axis – Selected Metric
Task 3.7
Create a new Power BI Visual “Donut Chart” on the report using “Channel” wise data from sales data tables and connect this with “Metric”, “Year” & “Quarter” report components. Changing the criteria in the selection of this Metric/Year/Quarter the corresponding information should be displayed.
Legend – Channel
Value – Selected Metric
Task 3.8
Create new Power BI Visual “Donut Chart” on the report using “Warehouse Code” wise data from sales data tables and connect this with “Metric”, “Year” & “Quarter” report components. Changing the criteria in the selection of this Metric/Year/Quarter the corresponding information should be displayed.
Legend – Warehouse Code
Value – Selected Metric
Task 3.8
Create a new Power BI Visual “Donut Chart” on the report using “Date” Column data from Dates data tables and connect this with “Metric”, “Year” & “Quarter” report components. Changing the criteria in the selection of this Metric/Year/Quarter the corresponding information should be displayed.
Legend – Date
Value – Selected Metric
Task 3.9
Create a new Measure “CumulativePerformance” on Selected Metric (previously calculated) on sales Data tables and display the results in Power BI Visual “Area Chart”
X Axis – Date
Y Axis – CumulativePerformance
Task 3.10
Create a new Power BI Visual “MAP” on the report with data from the “Territory” column of the Regions tables, and then connect this to the “Sales Data” table in order to present the sales broken down by territory when the user selects an area on the MAP.