SPAM Blocker for Blogs – ANTI SPAM Java Project

ABSTRACT :

Nowadays, spam comments have become a major issue in the blogs. In this project we are dealing with the eradication of the issue of spam comments. Basically, here the quality of the comment is determined, whenever the user adds a comment to the blog.

If the comment entered in the blog’s comment has inappropriate or unacceptable words, the system will not publish the comment instantly, instead it will create table where it will store all this kind of comments which will be later be verified by the authorized user.

The set of particular inappropriate words are stored in a CSV (Comma-Separated Values) file which will be compared with, each word of the comment posted by the user and determine whether to post the comment or not.

1. INTRODUCTION:

Spam is a blog also called as simple blog spam or comment spam. The purpose of this document is to define scope and requirements of a SPAM Blocker for Blogs (ANTI-SPAM) for a corporate house, which wanted their head of organization to have control over comments posted by the readers on their respective blogs. Since, the blogs are hosted on internet, it was extremely critical to prevent unacceptable content in comments.

ANTI-SPAM will determine the validity of comments entered on the client side on the basis of the following rules:

1. Comment should not be empty.
2. The words used in the comment should not be present in the dictionary created.

2. EXISTING SYSTEMS:

Spammers began to take advantage of the open nature of the comments in the blog by commenting inappropriate content which was causing inconvenience to the users. The authorized users did not have the control over the comments posted by reader on their respective blogs.

3. PROPOSED SYSTEM:

The proposed system will provide an effective way to determine the quality of comment in the blog article, whenever a reader adds a comment.

MODULES:

1. CSV Files uploading into database.
2. Authorized user rights and end user rights.

4. SYSTEM SPECIFICATIONS:

HARDWARE SPECIFICATIONS:

1. 2 GB RAM
2. 256 GB Hard-disk

SOFTWARE SPECIFICATIONS:

1. JAVA/JSP, Eclipse.
2. HTML
3. DB2 database
4. Operating system: Windows 7,8

5. REFERENCES:

1. Data structures and Algorithms made easy in java. (Narasimha karumanchi, M-tech, IIT Bombay)

2.http://www.serve.net/buz/hash.adt/java.001.html URL for the concepts on hashing.
3. http://en.wikipedia.org/wiki/Bloom_filter URL for the concepts on bloom Filter.

Collaborative Decision Making – Team Java Project

Introduction

The purpose of this document is to define scope and requirements of a Collaborative Decision Making Tool. It is a situation faced when individuals collectively make a choice from the alternatives before them.

The decision is then no longer attributable to any single individual who is a member of the group. Currently the employers waste significant time to convene and run meetings for arriving at a meaningful decision. This document is the primary input to the development team to architect a solution for this project.

Proposed System

TEAM will provide a web based multi voting tool for teams to quickly shortlist ideas, actionable items, and initiatives without having to call for a physical meeting.

Basic System Operation

The multi voting process is initiated by creating a call for multi voting for a certain set of ideas by an employee.

Landing Page

TEAM’s landing page is a tabbed page. The first tab shows all the active calls for multi voting. The second tab shows the list of active multi voting calls. The third tab lists all the closed multi voting calls initiated by the logged in employee.

Call for Multi Voting

An employer can call for multi voting. For this purpose, she/he

• Enters a title for multi voting
• Defines the objective briefly
• Selects a list of employees for multi voting
• Uploads the list of items for multi voting from a single column of CSV(Comma Separated Value) file
• Defines the maximum number of votes allowed

Upon saving it, an invite mail is sent to the selected employees to participate in the voting. The results are automatically determined on closing the voting.

System Specifications

Hardware Specifications

• 2GB RAM
• 256GB hard disk

Software Specifications

• Web based multi voting tool
• CSV file
• Windows 7 OS
• DB2 database
• Java/JSP

References and Text books

• Pearson education(www.pearsoned.co.in)
• Financial decision making – Hampton
• Managerial decision modelling-Balakrishnan

Fraudulent Expenses Detection Java Project

INTRODUCTION:
The purpose of this document is to define scope and requirements of an application to detect anomalies in the expense approval system hosted on the Intranet of a leading business house.

Increasing volumes of the expense claims due to wide operations required controls so that the unscrupulous employees don’t get a chance to forge claims and get away with undue claim re-imbursements.

IT team proposed a tool based on Benford’s law to scan the past approved expense claims and detect potential frauds for further manual investigation using the said distribution.

This document is the primary input to the development team to architect a solution for this project.

System Users:

The pre-audit team and the approving managers (supervisors) of expense claim will benefit from using Fraudulent Expenses Detection System, DETECT.

Assumptions

1 . The application will be hosted on the intranet server as part of the expense claim framework. The users will access the application from Audit menu in
the application.

2 . The transaction data of expense claims for at least 6 months shall be uploaded into the system from the backend in CSV format. To simplify the
scope of this project, it can be assumed that each claim has fields viz. (a) claim id, (b) date, (c) employee’s name, (d) supervisor’s name, and (e)
claimed amount. In real life, such data will reside in multiple tables.

3 . Since DETECT is expected to use Intranet’s authentication, for the purpose of this project, entering user name will take you to the user’s DETECT
screen. You may create sample users directly from the backend database

REQUIREMENTS:

DETECT allows the pre-audit team to run this application for a transaction period.

Basic System Operation

The following steps outline the basic system operation in context of the end-user:

Detect Fraudulent Expense

1 . The system displays list of recently uploaded CSV files. User selects the desired CSV file and clicks on “detect” button.
2 . System alerts if the selected CSV has data for less than 6 months and aborts further execution; otherwise it proceeds to scanning process outlined in step #3.
3 . DETECT scans through all the expense claims from the CSV file. It reads each claim amount and generates a Benford’s frequency distribution.
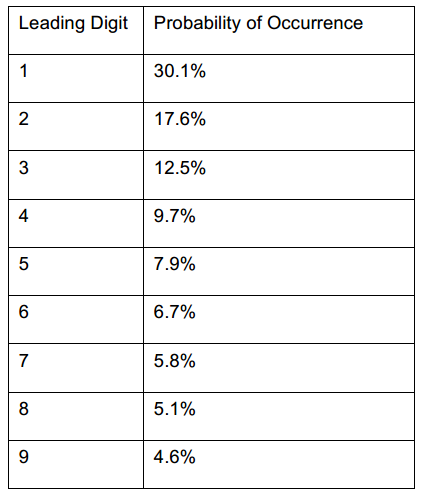
4 . The system displays the Frequency distribution generated by the application along with the Benford’s distribution and its percentage deviation from Benford’s distribution.
5 . The rows that have more that 5% deviation from the Benford’s distribution are highlighted in Yellow color.
6 . The auditor can flag the Yellow color rows to generate the list of transactions that require validation by the Supervisor. For each flagged transaction, the system automatically builds a supervisor wise index of all such claims.

Investigate Flagged Expense Claims

1 . The system shall notify the supervisors of respective claims that are shortlisted by the application.
2 . The list of all flagged transactions to be reviewed by a supervisor are displayed to him/her by DETECT.
3 . The supervisor clicks on the Claim id to access the complete record. The claim record opens up displaying employee name, type of expense, date,
description and amount.
4 . The supervisor can either mark a claim as “valid” or “false claim”. DETECT removes the valid claims from the index.

False Claims

1 . The pre-audit user can view the claims marked as False Claim by the supervisors.
2 . Action on such claims is taken outside the system.

A user-friendly interface needs to be developed to ensure smooth usage of the system.

About Benford’s Law

Benford’s law, also known as the first-digit law, it says that in lists of numbers from many real-life sources of data, the leading digit is distributed in a specific, nonuniform way.

The standard Benford’s Distribution is outlined on the next page.

Auditors use this law to find patterns in data where there is a possibility of a fraud.

Such data is taken up for further investigation. Learn more about Benford’s law at http://mathworld.wolfram.com/BenfordsLaw.html URL.

Fraudulent Expenses Detection - DETECT
DEVELOPMENT ENVIRONMENT

DETECT will be developed as a web application using Java/JSP and DB2 database. Eclipse will be used as the IDE for the same. You may consider using a
JavaScript framework like Prototype/ Scriptaculous/jQuery. JSON specifications can be found at http://www.json.org/ URL.

Information Aggregator – Dashboard Java Project

Abstract:

The purpose of this project is to define scope and requirements for an Information Aggregator – Dashboard, to be developed for Top Management in Sales, Product and Merchandise functions of a Retail house. Replacing the traditional flash reports every morning pouring in from various locations. A live dashboard on intranet will provide a status on various metrics that corporate office wishes to monitor.
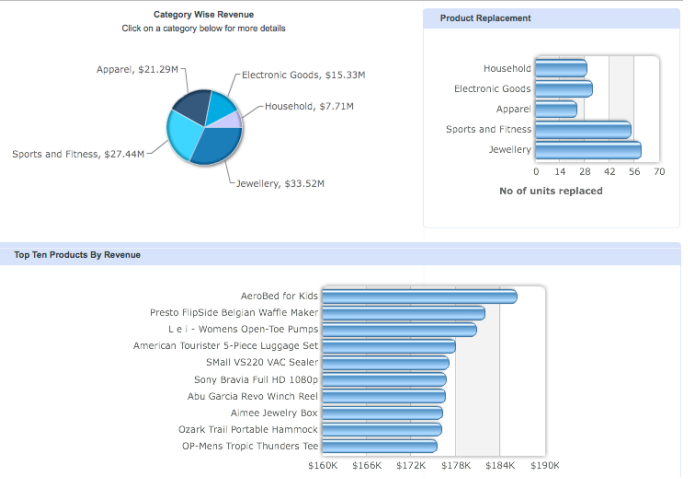
The dashboard will be a simple snapshot of Category wise revenue, Product Returns and Top Ten Revenue generating products.

This document is the primary input to the development team to architect a solution for this project.
Retail Challenges In retail, the individual product performance is very critical, as their procurement sources could be different, factors like delivery turnaround time, defect piece handling, returns, trendiness, buyer segment appeal determine which products should be discontinued and new items to be introduced. Retail business has to take care of the small time window availability arising from the festive season or otherwise seasonal changes especially in case of merchandise. Study of product sales patterns, buying habits and popularity is vital to success of the retail business.

Just by adding analytics to the daily purchase and billing data empowers a decision maker to roll out realistic plans.

System Users

The Corporate office Management will be users of the Information Aggregator, Dashboard.

Assumptions

1 . Dashboard will be integrated with the Retail House’s intranet, thus use the login and authentication mechanism of intranet only.
2 . On logging in the user gets to view the landing page displaying dashboard.
3 . The dashboards are normally created using data from the core applications in the organization. In the case of Retail houses, the data gets stored on the central server from the Point of Sales (Billing) at each location. In this project, the data feed is coming from CSV files generated by the central database server of the Retail House.
4 . The developer of this tool is expected to read and familiarize with Google Chart tools.
5 . There are two types of charts PIE and Bar Chart being used for creating a Dashboard.

INTRODUCTION:

The Dashboard tool will read data uploaded from back end as per the formats given below and process the data to generate Product Analytics like a sample view provided below.
The Dashboard has 3 sections; you may change the look and feel to ensure best fit of charts that will get integrated using Google Charts API.
The retail house markets 5 categories of products; Apparels, Electronic Goods, Household, Jewelry and Sports & Fitness.
The category wise revenue displays a pie chart of total sales value billed under each category.
Product Replacements section plots the category wise count of items returned under them.
Top Ten Products by Revenue, plots 10 items that have had maximum sales for all the categories by default.

Input Data
The following input data is required to be uploaded as CSV to generate these charts.

REQUIREMENTS
Information Aggregator - Dashboard Java Project
Product Category (Master)
Category id and Category Name

Items (Master)
Category id, Item id and Item name

Revenue Data (Transaction)
Bill Date, Category id, Item id, Qty and Value

Product Return (Transaction)
Bill Date, Category id, Item id, Qty and Value
Tip: While generating output the category name and item name shall come from master tables.

Charts – Must haves
1 . Each chart in the section must have a title, data labels and series title wherever applicable.
2 . On mouse hover, the actual data values be it % or Sales Value is displayed.
3 . User should be able to select the month if required to look at previous data. By default the current months figures till date should be displayed.
4 . For the adventurous developer, you may make the pie chart category selection refresh the page for other sections to display data specific to the pie chart category selected.
Dashboard will be developed as a web application using Java/JSP and DB2 database. Eclipse will be used as the IDE for the same. Knowledge of XML is a must for this project.
Refer to the charts tools from Google to integrate in the dashboard https://developers.google.com/chart/