AI4Jobs: A Machine Learning Framework for Fake Recruitment Detection in Online Portals
Abstract
With the growing influence of online job portals and recruitment platforms, fake job postings have become a major cyber threat, targeting job seekers and exploiting their personal information. This project proposes a machine learning-based system to automatically detect fake job postings using NLP and classification algorithms. By analyzing job descriptions and related metadata, the system leverages models like Logistic Regression, Random Forest, SVM, and others to classify whether a job post is genuine or fraudulent. The proposed model achieves high accuracy and enables real-time detection through a web interface built using Flask.

Introduction
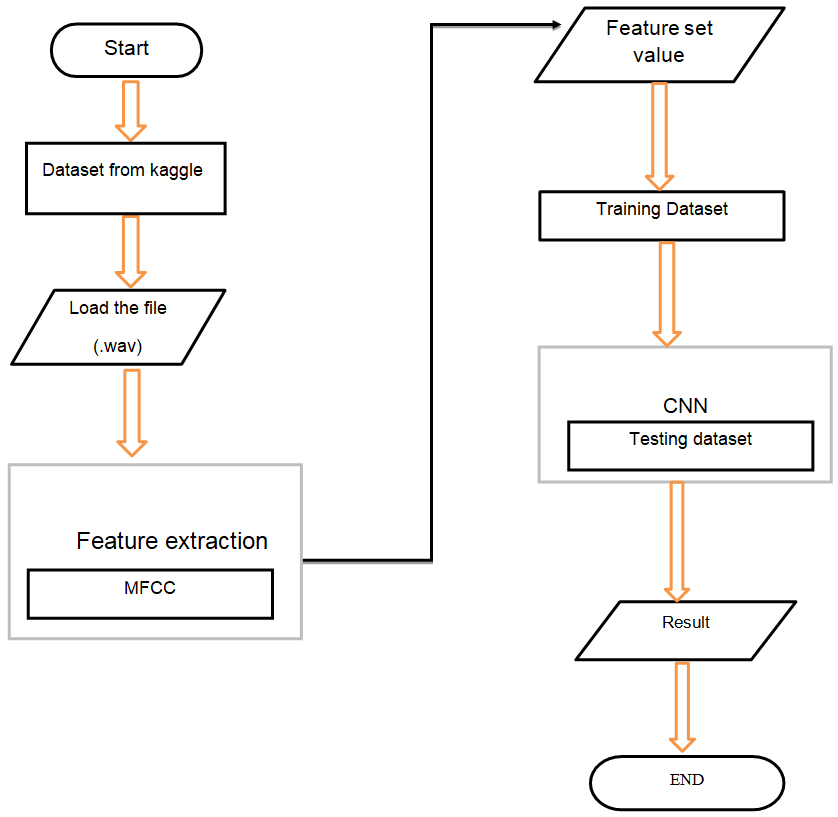
In the digital age, job seekers often rely on online platforms for career opportunities. However, cybercriminals exploit this reliance by posting fraudulent job advertisements to collect sensitive information or extort money. Manual detection is inefficient due to the massive volume of listings. This system employs machine learning models to automate the classification of job postings as real or fake, ensuring a secure recruitment experience. It uses data pre-processing, TF-IDF feature extraction, and various supervised learning techniques to achieve accurate predictions.

Problem Statement
How can we accurately detect and classify fake job postings using automated systems that analyze textual content and metadata, in order to protect users from employment fraud?

Existing System and Disadvantages
Existing Systems:
- Manual moderation of job posts
- User reporting systems
- Simple keyword filters or rule-based checks
Disadvantages:
- Time-consuming and error-prone
- Inability to scale to thousands of posts per day
- High false negatives and low detection rates

Proposed System and Advantages
Proposed System:
- A machine learning pipeline using Natural Language Processing (NLP) for text-based analysis
- Multiple ML classifiers trained on historical job posting data
- Flask-based web interface for user interaction and prediction
Advantages:
- Automated, real-time detection of fake job posts
- High classification accuracy using ensemble ML techniques
- Scalable and adaptive to new data
- Protects users from scams and identity theft
Modules
- Data Pre-processing Module
- Cleans and prepares data by handling missing values and irrelevant features
- Feature Extraction Module
- Applies TF-IDF to convert job descriptions into numerical vectors
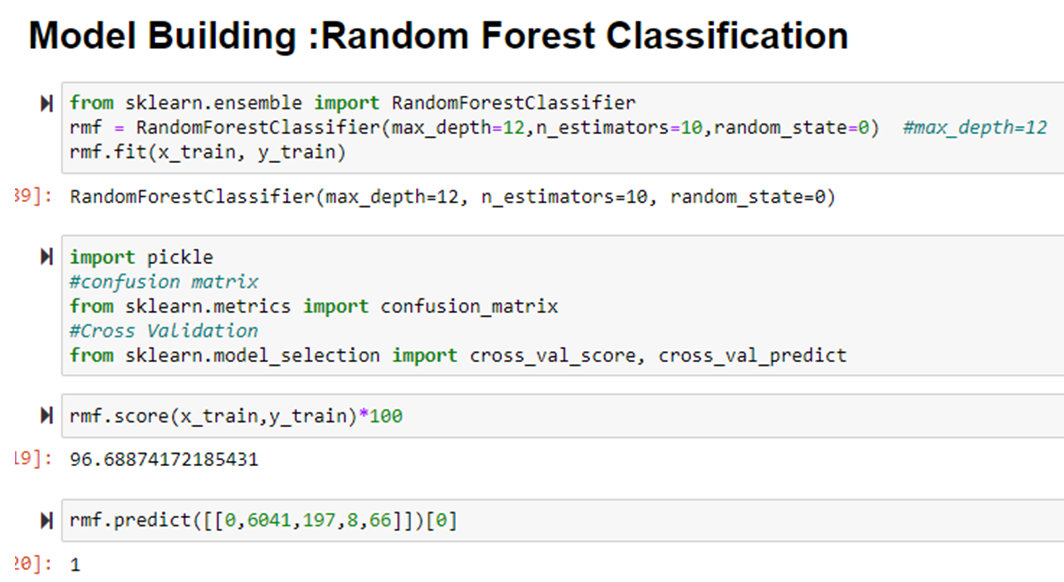
- Model Training Module
- Trains multiple models (Naive Bayes, SVM, Random Forest, etc.) on labeled data
- Prediction Module
- Provides predictions for new job posts through the trained models
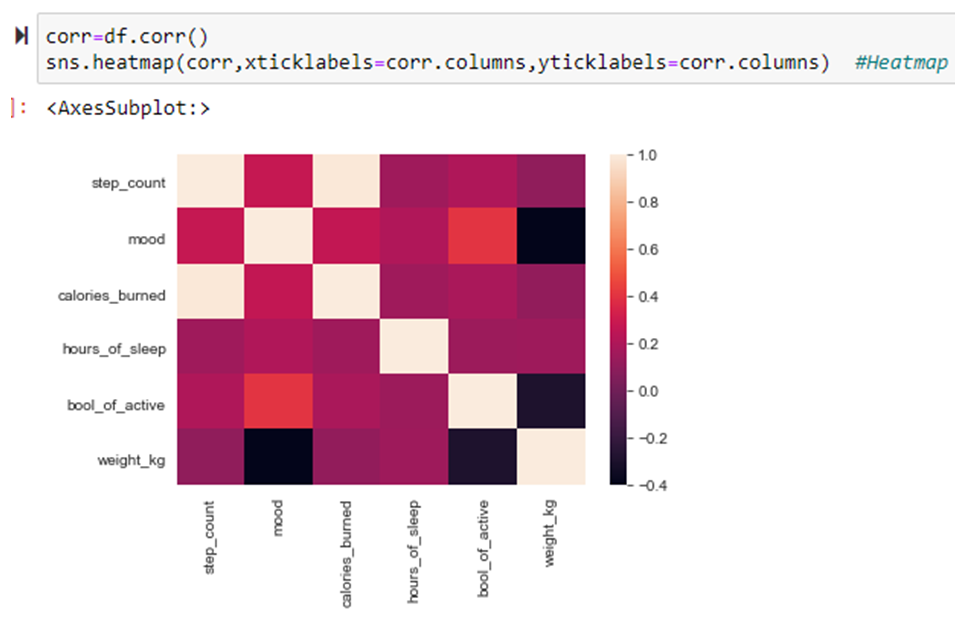
- Visualization & Analysis Module
- Displays confusion matrix, accuracy graphs, and classification reports
- Web Interface Module (Flask)
- Allows users to input job descriptions and get results
Algorithms / Models Used
- Logistic Regression
- Random Forest
- Support Vector Machine (SVM)
- Decision Tree
- K-Nearest Neighbors (KNN)
- Naive Bayes
- TF-IDF Vectorization for text processing

Software Requirements
|
Component |
Technology |
|
Frontend |
HTML, CSS, JavaScript |
|
Backend |
Python, Flask |
|
Database (Optional for logging) |
MySQL |
|
Libraries |
scikit-learn, pandas, matplotlib, joblib, seaborn |
Hardware Requirements
|
Component |
Specification |
|
Processor |
Intel i3 or above |
|
RAM |
4GB minimum |
|
Storage |
100MB (for dataset and models) |
|
OS |
Windows/Linux/Mac |
Conclusion
The project successfully demonstrates the use of machine learning to detect fake job postings with high accuracy. By analyzing textual data from job advertisements, the system can proactively classify fraudulent content and prevent potential exploitation of job seekers. The implementation of multiple ML models provides comparative performance insights, with ensemble models like Random Forest and SVM showing the best results.

Future Enhancement
- Integrate deep learning models (LSTM or BERT) for better contextual understanding
- Build an alert system to flag suspicious postings automatically on job portals
- Include user feedback loops to improve model retraining
- Extend support for multi-language job postings
- Add database integration for storing logs and user sessions