Decision Model for Prediction of Movie Success Rate Data Mining J Component Project

ABSTRACT

The purpose of this Movie Success Rate Prediction project is to predict the success of any upcoming movie using Data Mining Tools. For this purpose, we have proposed a method that will analyze the cast and crew of the movie to find the success rate of the film using existing knowledge. Many factors like the cast (actors, actresses, directors, producers), budget, worldwide gross, and language will be considered for the algorithm to train and test the data. Two algorithms will be tested on our dataset and their accuracy will be checked.

 LITERATURE REVIEW

  • They developed a model to find the success of upcoming movies based on certain factors. The number of audience plays a vital role in a movie becoming successful
  • The factorization Machines approach was used to predict movie success by predicting IMDb ratings for newly released movies by combining movie metadata with social media data
  • Using the grossattribute as a training element for the model. The data are converted into .csv files after the pre-processing is done
  • Using S-PLSA – the sentiment information from online reviews and tweets, we have used the ARSA model for predicting the sales performance of movies using sentiment information and past box office performance.
  • A mathematical Model is used to predict the success and failure of upcoming movies depending on certain criteria. Their work makes use of historical data in order to successfully predict the ratings of movies to be released
  • According to them, Twitter is a platform that can provide geographical as well as timely information, making it a perfect source for spatiotemporal models.
  • The data they collected was gathered from Box Office Mojo and Wikipedia. Their data was comprised of movies released in 2016
  • Initially having a dataset of 3183 movies, they removed movies whose budget could not be found or missed key features in the end a dataset of 755 movies were obtained. After Key feature extraction was completed.
  • some useful data mining on the IMDb data, and uncovered information that cannot be seen by browsing the regular web frontend to the database.
  • According to their conclusion, brand power, actors or directors isn’t strong enough to affect the box office.
  • Their neural network was able to obtain an accuracy of 36.9% and compromising mistakes made within one category an accuracy of a whopping 75.2%
  • They divided the movies into three classes rise, stay, and fall finding that support vector machine SMO can give up to 60% correct predictions
  • The data was taken from the Internet Movie Database or IMDb as the data source, the data they obtained was from the years 1945 to 2017.
  • A more accurate classifier is also well within the realm of possibility, and could even lead to an intelligent system capable of making suggestions for a movie in preproduction, such as a change to a particular director or actor, which would be likely to increase the rating of the resulting film.
  • In this study, we proposed a movie investor assurance system (MIAS) to aid movie investment decisions at the early stage of movie production. MIAS learns from freely available historical data derived from various sources and tries to predict movie success based on profitability.
  • The data they gathered from movie databases was cleaned, integrated, and transformed before the data mining techniques were applied.
  • They used feature, extraction techniques, and polarity scores to create a list of successful or unsuccessful movies. This was done by gathering the data using IMDb and YouTube.

PROBLEM STATEMENT

in this Movie Success Rate Prediction project, The method of using the ratings of the films by the cast and crew has been an innovative and original way to solve the dilemma of film producers. Film producers have often trouble casting successful actors and directors and still trying to keep a budget. Looking at the average ratings of each actor and director together with all the films they participated in should be able to give the producer a good idea of who to cast and who not to cast in a film that is to be out right now.
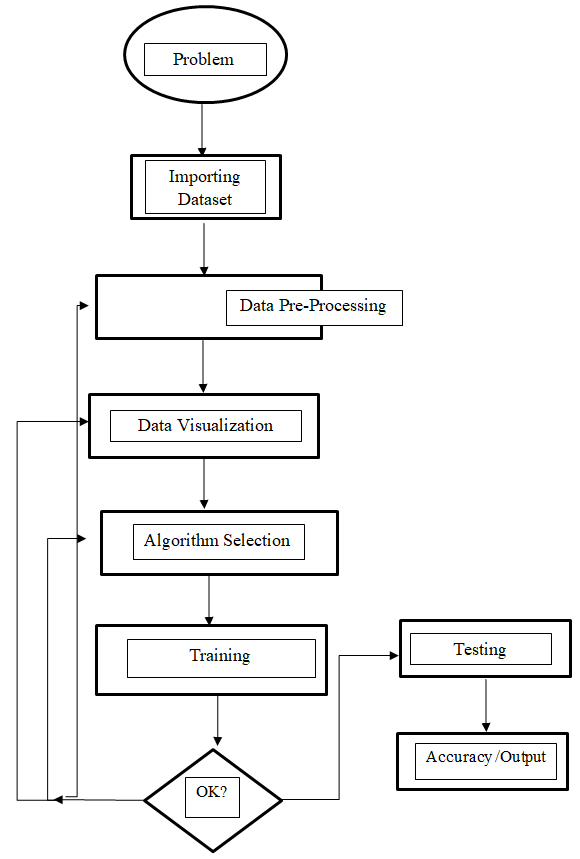
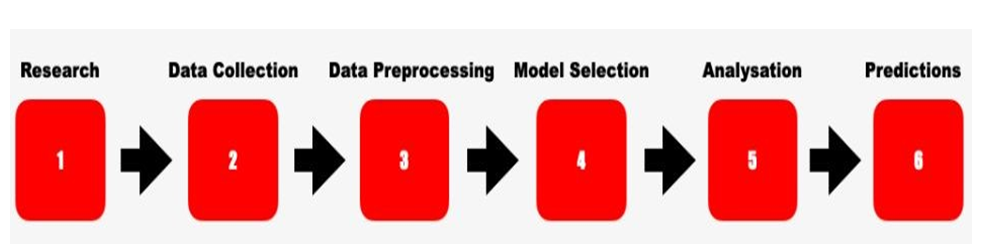
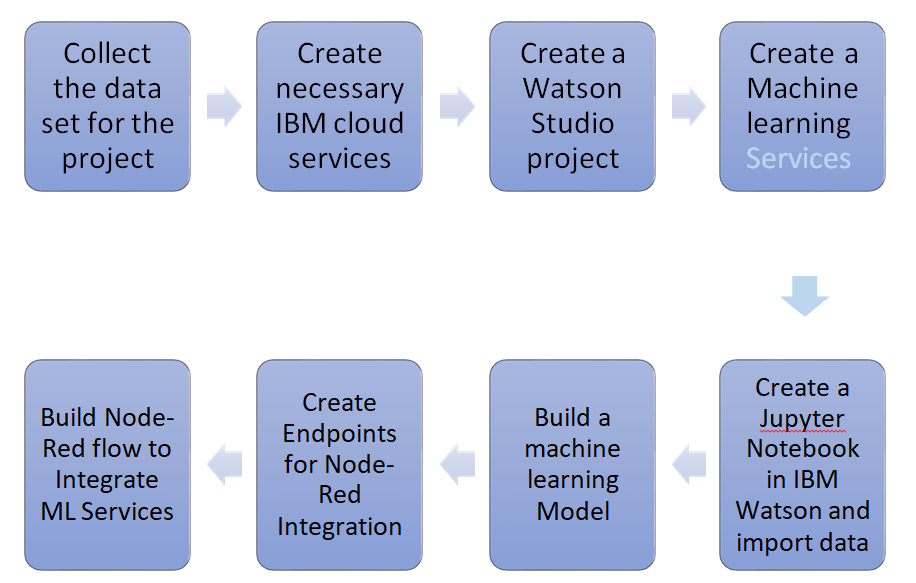
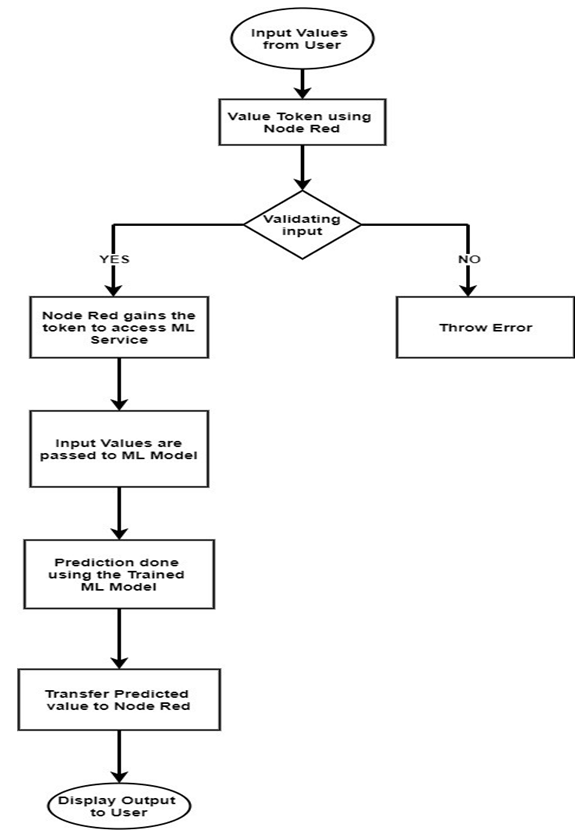
Implementation:

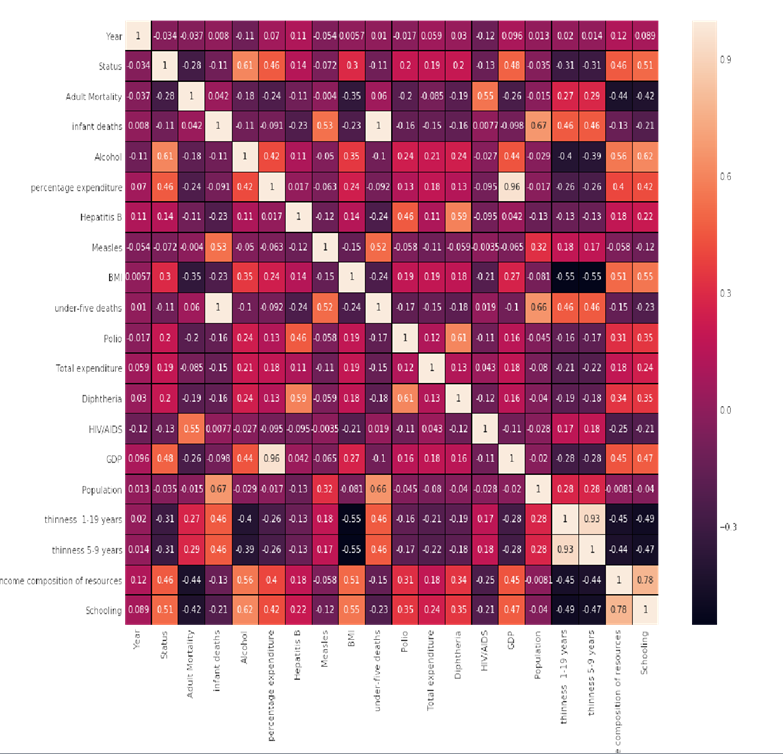
  • Data Preprocessing & Correlation Analysis
  • Application of Decision Tree Algorithm
  • Application of Random Forest Algorithm

RESULTS & CONCLUSION

After testing both the algorithms on the IMDb dataset i.e. Decision Tree and Random Forest algorithm, we found that the Random Forest algorithm got a better accuracy (99.6%) on the data rather than the decision tree algorithm in which we obtained just 60% accuracy.

Predict the Forest Fires Python Project using Machine Learning Techniques

Predict the Forest Fires Python Project using Machine Learning Techniques is a Summer Internship Report Submitted in partial fulfillment of the requirement for an undergraduate degree of  Bachelor of Technology In Computer Science Engineering. I submit this industrial training workshop entitled “PREDICT THE FOREST FIRES” to the University, Hyderabad in partial fulfillment of the requirements for the award of the degree of “Bachelor of Technology” in “Computer Science Engineering”. 

Apart from my effort, the success of this internship largely depends on the encouragement and guidance of many others. I take this opportunity to express my gratitude to the people who have helped me in the successful competition of this internship.

I would like to thank the respected faculties who helped me to make this internship a successful accomplishment.

I would also like to thank my friends who helped me to make my work more organized and well-stacked till the end.

OBJECTIVE OF THE PROJECT:

This is a regression problem with clear outliers which cannot be predicted using any reasonable method. A comparison of the three methods has been done :

(a) Random Forest Regressor,
(b) Neural Network,
(c) Linear Regression

The output ‘area’ was first transformed with an ln(x+1) function.

One regression metric was measured: RMSE and r2 score is obtained. An analysis of the regression error curve(REC) shows that the RFR model predicts more examples within a lower admitted error. In effect, the RFR model predicts better small fires, and the r2 score is obtained by using Linear Regression.

Best Algorithm for the project:

The best model is the Random Forest Regressor which has an RMSE value of 0.628 for which we are using GridSearchCV.

Scikit-learn has the functionality of trying a bunch of combinations and seeing what works best, built-in with GridSearchCV. The CV stands for cross-validation.

MODEL BUILDING

PREPROCESSING OF THE DATA:

Preprocessing of the data actually involves the following steps:

GETTING THE DATASET:

we can get the data from the client. we can get the data from the database.
https://archive.ics.uci.edu/ml/datasets/forest+fires

IMPORTING THE LIBRARIES:

We have to import the libraries as per the requirement of the algorithm.

IMPORTING THE DATA SET:

Pandas in python provide an interesting method read_csv(). The read_csv function reads the entire dataset from a comma-separated values file and we can assign it to a DataFrame to which all the operations can be performed. It helps us to access each and every row as well as columns and each and every value can be accessed using the data frame. Any missing value or NaN value has to be cleaned.

HANDLING MISSING VALUES:

OBSERVATION:

As we can see there are no missing values in the given dataset of forest fires

DATA VISUALIZATION:

  • scatterplots and distributions of numerical features to see how they may affect the output ‘area’
  • Boxplot of how categorical column day affects the outcome
  • Boxplot of how categorical column month affects the outcome

CATEGORICAL DATA:

  • Machine Learning models are based on equations, we need to replace the text with numbers. So that we can include the numbers in the equations.
  • Categorical Variables are of two types: Nominal and Ordinal
  • Nominal: The categories do not have any numeric ordering between them. They don’t have any ordered relationship between each of them. Examples: Male or Female, any color
  • Ordinal: The categories have a numerical ordering between them. Example: Graduate is less than Post Graduate, Post Graduate is less than Ph.D. customer satisfaction survey, high low medium
  • Categorical data can be handled by using dummy variables, which are also called indicator variables.
  • Handling categorical data using dummies: In the panda’s library, we have a method called get_dummies() which creates dummy variables for those categorical data in the form of 0’s and 1’s.
  • Once these dummies got created we have to concat this dummy set to our data frame or we can add that dummy set to the data frame.
  • Categorical data-column ‘month
  • dummy set for column ‘month’
  • Categorical column-‘day’
  • dummy set for column ‘day’
  • Concatenating dummy sets to a data frame
  • Getting dummies using label encoder from scikit learn package
  • We have a method called label encoder in scikit learn package. we need to import the label encoder method from scikitlearn package and after that, we have to fit and transform the data frame to make the categorical data into dummies.
  • If we use this method to get dummies then in place of categorical data we get the numerical values (0,1,2….)
  • importing label encoder and one hot encoder
  • Handling categorical data of column month
  • Handling categorical data of column day

TRAINING THE MODEL:

  • Splitting the data: after the preprocessing is done then the data is split into train and test set
  • In Machine Learning in order to access the performance of the classifier. You train the classifier using a ‘training set’ and then test the performance of your classifier on an unseen ‘test set’. An important point to note is that during training the classifier only uses the training set. The test set must not be used during the training of the classifier. The test set will only be available during the testing of the classifier.
  • training set – a subset to train a model. (Model learns patterns between Input and Output)
  • test set – a subset to test the trained model. (To test whether the model has correctly learned)
  • The amount or percentage of Splitting can be taken as specified (i.e. train data = 75%, test data =25% or train data = 80%, test data= 20%)
  • First we need to identify the input and output variables and we need to separate the input set and output set
  • In scikit learn library we have a package called model_selection in which the train_test_split method is available. we need to import this method
  • This method splits the input and output data to train and test based on the percentage specified by the user and assigns them to four different variables(we need to mention the variables)

 EVALUATING THE CASE STUDY:

Building the model (using splitting):

First, we have to retrieve the input and output sets from the given dataset

  • Retrieving the input columns
  • Retrieving output column

MODEL BUILDING:

  • Defining Regression Error Characteristic (REC)

Download the complete project Code, Report on Predict the Forest Fires using Project using Machine Learning Techniques

Analysis Of Energy Consumption In India Python Project

Energy is one of the most important resources available to man and it is necessary to keep a check on the growing need for energy day by day.

The Issue of the availability of Energy is getting prominent these days. So to analyze the consumption of energy and production of Energy via available Energy Resources is important.

The project describes the consumption of energy resources of all states of India in the last few years with respect to the population of India state-wise and predicts the future energy requirements for every state.

INTRODUCTION

India is a growing economic superpower. At this point in time, we are sitting at the tip of our economic explosion. The vast reserves of resources in all factors of production have earned us the title of The Land of Potential. But this comes at a cost, with this growth potential comes the need to satisfy the potential through the generation of energy.

To meet this challenge of growing energy is very important for India and it is even more important to predict the future requirements of energy in our country.

If we are able to predict the energy required in the future it will boost the potential of the country and increase the overall growth in every field

Background and Basics:

The programming language Python is very useful for the analysis of data in every field.
Python has been used to show the analysis of data in a diagrammatical format like a Pie Chart, Bar Chart, and Multiple Bar Chart.
It also shows a map of India with respect to the intensity of Energy Consumption as well as the Population of India state-wise. By using Machine Learning.
We have predicted the requirement of the amount of energy for every state using The Linear Regression Machine Learning Algorithm. It uses two parameters on the outcome and one on which the outcome depends
The population has been used as a parameter on which energy depends

Future Use

This program gives a clear idea about the energy requirement in the Future.

Software and Hardware Requirements

Details of software

Python
Anaconda (Spyder) IDE
Required Python Libraries:
Numpy
Pandas
Matplotlib
Tkinter
PIL
Mpl_toolkits.basemapDetails of hardware

Details of Hardware

Working PC

Methodology

The SUBMIT button on the GUI checks the availability of state i.e.it checks the correct state.

The PIE Chart on the GUI plots the energy resource required percentage-wise.
The BAR Chart on the GUI plots the energy resource required percentage-wise.
Flow of Project
Our project takes a dataset of the population from the year 2013 to 2017 and energy requirements in India per state from the year 2013 to 2016.

The data from every set from the years 2013-16 has been used in order to train the machine using linear Regression and data from 2017 for the population has been used in order to test the model to predict the future requirement of energy.

The energy requirements predicted as well as actually have been represented using the map of India i.e. greater the intensity on the map higher the energy required for that state, bar chart, and Pie chart.

Results and Discussion

Pie Chart of Energy Resources of Maharashtra Year 2015
Resource-wise Production of energy

Map of India according to energy consumption

Conclusion

We have used python to show the analysis of data in a diagrammatical format like a Pie Chart, Bar Chart, and Multiple Bar Chart.
It also shows a map of India with respect to the intensity of Energy Consumption as well as the Population of India state-wise.
By using Machine Learning, we have predicted the requirement of the amount of energy in the specified year for each state in India.
Technologies used in the project are Python, Machine learning, and Data Analysis.
This program gives a clear idea about the energy requirement in the Future.

Fake Disaster Tweet Detection Web-App Python Machine Learning Project

This project “Fake Disaster Tweet Detection” aims to help predict, whether a tweet weather it is fake or real. It uses the Multinomial Naïve Bayes approach for detecting fake or real tweets from existing datasets available on Kaggle. The classifier will be trained only on text data. Traditionally text analysis is performed using Natural Language Processing also known as NLP. Natural language processing is a field that comes under Artificial Intelligence. Its main focus is on letting computers understand human language and process it. NLP helps recognize and predict diseases using speech, it helps in sentiment analysis, cognitive assistant, spam detection, the healthcare industry, etc. In this project Training Data is pre-processed, then sent to the classifier, then and the classifier predicts weather the tweet is real or fake.

This project is made on Jupyter Notebook which is a part of Anaconda Navigator. This project ran successfully on Jupyter Notebook. The dataset was successfully loaded into the notebook. All the extra python packages which were required for project completion were also loaded into the notebook. The model is also deployed successfully using HTML, CSS, python, and flask.

The accuracy score on test data is 77.977%. average recall value is 0.775 and the average precision score is 0.775. Precision is used to calculate a number of correct positive predictions made by the model. The recall is used to calculate the number of correct positive predictions made out of all the positive predictions that could have been made.

System Design

System Flowchart

System Flowchart

Problem: To detect disaster tweets whether it’s fake or real using a machine learning algorithm. In this, the concept of Natural language Processing is used.

Identification of data: In this project, I have used a dataset available on Kaggle competition based on Natural language processing. This project works only on text data. It has five columns:

  1. Id: It tells the unique identification of each tweet
  2. Text: It tells the tweet in text form
  3. Location: It tells the place from where the tweet was sent and it can be blank
  4. Keyword: It tells a particular word in the tweet and it can be blank
  5. Target: It tells the actual value of the tweet weather it’s a real tweet or Fake

Data-preprocessing: First the preprocessing is done in the dataset which includes the removal of punctuations, then the removal of URLs, digits, non-alphabets, and contractions, then tokenization and removing Stopwords, and removing Unicode. Then lemmatization is done on the dataset. After preprocessing Countvectorizer is used to convert text data into numerical data as the classifier only works for numerical data. The dataset is then split into 70% training data and 30% test data.

Definition of Training Data: The training dataset which contains 70% of the whole dataset is used for training the model.

Algorithm Section: In this project Multinomial Naïve Bayes classifier algorithm is used for detecting disaster tweets whether they are fake or real.

Evaluation with test set: Several text samples are passed through the model to check whether the classification algorithm gives the correct result or not.

Prediction Model

Implementation Work Details

The data-set which is used in this project “Fake disaster tweet detection” is taken from the Kaggle competition “Natural Language Processing with Disaster Tweets”. The data set contains 7613 samples. This project works only on text data. It has five columns:

  • Id: It tells the unique identification of each tweet
  • Text: It tells the tweet in text form
  • Location: It tells the place from where the tweet was sent and it can be blank
  • Keyword: It tells a particular word in the tweet and it can be blank
  • Target: It tells the actual value of the tweet weather it’s a real tweet

Step 2: Data-Preprocessing

  1. Removing Punctuations: Punctuations are removed with the help of the following python code
  1. Removing URLs, digits, non-alphabets, _: True means it has HTTP, and False means it does not have HTTP
  1. Removing Contraction: It expands the words which are written in short form like can’t is expanded into cannot, I’ll is expanded into I will, etc.
  1. Lowercase the text, tokenize them, and remove Stopwords: Tokenizing means splitting the text into a list of tokens. Stopwords are the words in the text which does not provide additional meaning to the text.
  1. Lemmatizing: It converts any word into its root form like running, ran into a run.
  1. Countvectorizer:

Text cannot be used to train our model, it has to be converted into numbers that our computer can understand, so far in this project, Countvectorizer is used. Countvectorizer counts the number of times each word appears in a document. Countvectorizer works as:

Step1: It first identifies unique words in the complete dataset.

Step 2: then it will create an array of zeros for each sample of the same length as above Step 3: It then takes each word at a time and find its occurrence in each sample in the dataset. The number of times the word appears in the sample will replace the zero positioned at the word in the list. This will repeat for every word. 

Step 3: Model Used:

In this project, the Multinomial Naïve Bayes approach is used for detecting fake or real tweets from existing datasets available on Kaggle. Naïve Bayes classifier is based on the probability theorem “Bayes Theorem” and also has an assumption of conditional independence among every pair.

System Testing

This project is made on Jupyter Notebook which is a part of Anaconda Navigator. This project ran successfully on Jupyter Notebook. The dataset was successfully loaded into the notebook. All the extra python packages which were required for project completion were also loaded into the notebook. The model is also deployed successfully using HTML, CSS, python, and flask.

The machine learning model is evaluated we normally use classification accuracy which is the number of correct predictions divided by the total number of predictions.

This accuracy measuring technique works well when there is an equal number of samples in the dataset belonging to each class. The accuracy score on test data is 77.977%. average recall value is 0.775 and the average precision score is 0.775. Precision is used to calculate a number of correct positive predictions made by the model. The recall is used to calculate the number of correct positive predictions made out of all the positive predictions that could have been made.

  • Precision = True Positives / (True Positives + False Positives)
  • Recall = True Positives / (True Positives + False Negatives)

Conclusion

In this project only one classification algorithm is used which is Multinomial Naïve Bayes. First, the preprocessing is done in the dataset which includes the removal of punctuations, then removal of URLs, digits, non-alphabets, and contractions, then tokenization and removing Stopwords, and removing Unicode. Then lemmatization is done on the dataset. After preprocessing Countvectorizer is used to convert text data into numerical data as the classifier only works for numerical data. The dataset is then split into 70% training data and 30% test data. The accuracy score on test data is 77.977%. average recall value is 0.775 and the average f1 score is 0.775.

Future Scope

In the future, some other classification algorithms can also be tried on this dataset like KNN, Support vector machine (SVM), Logistic Regression, and even Deep learning algorithms can also be used which give very high accuracy. Vectorizing can be done using other methods like word2vec, Tf-Idf vectorizer, etc.

Download the Complete Project on ake Disaster Tweet Detection Web Application Python-based Machine Learning Project.

Covid-19 Outbreak Prediction Using Machine Learning Python Project

The aim of this Covid-19 Outbreak Prediction project is to make a model which will forecast the number of confirmed cases covid-19 virus in the upcoming days. Covid-19 is an infectious disease that is affecting a huge number of people all around the world.

This virus was first identified in Wuhan, China, and later spread throughout the world causing a pandemic that forced most countries to go into lockdown.

Various machine learning models and time series forecasting models.

The predictive model will be created using machine learning and using the dataset obtained from Kaggle. Machine learning automates the formation of analytical models. It is a branch of artificial intelligence focused on the principle that data can be learned from processes, It can find patterns and take decisions.

Time series forecasting will be used which is a type of predictive model. Time series forecasting is the use of a model centered on earlier observed values to evaluate future values. 

INTRODUCTION

The aim of this project is to make a predictive model which will predict the trajectory of the outbreak of the covid-19 virus in the upcoming days. Covid-19 is an infectious disease that is affecting a huge number of people all around the world.

It was first identified in Wuhan, China, and then later spread all over the world causing a pandemic.

Since no vaccine is developed which can be available all throughout the world, we have to take preventive measures which can stop the spread of the disease. Since a lockdown cannot last forever, we have to know how fast the spread is and how much more people will be infected.

The predictive model will be created using machine learning and using the dataset obtained from Kaggle. Machine learning automates the formation of analytical models. It is a branch of artificial intelligence focused on the principle that data can be learned from processes, It can find patterns and take decisions.

Time series forecasting will be used which is a type of predictive model. Time series forecasting is the use of a model centered on earlier observed values to evaluate future values.

PRESENT SYSTEM

Various work on this problem related to covid-19 is being done. Officials all over the world are using several outbreak prediction models for covid-19 to make informed decisions and implement relevant control measures. Simple statistical models have received greater attention from authorities among the standard models for covid-19 global pandemic prediction. One of the works suggests using SEIR models. SEIR means susceptible-exposed-infected-recovered model.

This model aims to forecast factors like the spread of a disease, the total number of infected, and the span of an outbreak, and estimate different epidemiological parameters like the number of reproductive. Such models can illustrate how the outcome of the disease can be affected by various public health measures.

PROPOSED SYSTEM 

In this project, we will first collect and evaluate the dataset. We will transform the raw data into an accessible format and visualize it using data preprocessing. Various machine learning algorithms such as Linear regression, polynomial regression, SVM, holt’s linear model, Holt’s winter model, AR model, ARIMA model, and SARIMA model are used. The tools used in this project are mainly sklean for model selection, and NumPy library which is used to work with the arrays and pandas that use a key data structure called a data frame that allows us to store and manipulate tabular data in observation rows and variable columns, matplotlib is a library of plotting that is used to plot graphs. After implementing the model, the model with the least mean square error will be considered the best-fit model.

System Design 

The dataset is first preprocessed and visualized so that it is in a usable format for analysis. After this, we model the data using Linear regression, polynomial regression, SVM, holt’s linear model, Holt’s winter model, AR model, ARIMA model, and SARIMA. Then we evaluate the model and choose the best one according to its root mean square.

The flowchart depicts the following

Dataset 

The dataset involves the collection of data from various sources.

Data Pre-processing and visualization 

In order to obtain accurate results, data preprocessing is done to check if there is any inconsistency in the data, if there is it is handled accordingly. We then visualize the data to study the pattern and trends in the data.

Model Building 

Various models are used in this project-: Linear Regression

Polynomial Regression SVM

Holt’s Linear

Holt’s Winter Model

Auto Regressive Model (AR)

Moving Average Model (MA) ARIMA Model

SARIMA Model

DATASET

In this project, the dataset is taken from Kaggle which is the Novel Corona Virus 2019 Dataset and the goal is to study the effect and spread of COVID-19 in the coming days, and conduct predictions and time series forecasting.

Hardware and Software Details 

  •  Software Details Python 3.7(64-bit) Jupyter notebook

Implementation work details  

First, the data is pre-processed and visualization is done and analyzed. Afterward, various models are used to train the data and the model with the least root mean squared error is selected as the best fit model. Various machine learning models are used and time series forecasting models such as holt’s linear model and ARIMA model are used. The dataset is obtained from Kaggle.

Real-life applications 

It can be used by the government for predicting the extent of the spread of the infectious disease and take action accordingly.

Data implementation and program execution 

The data is analyzed and visualized afterward. On different models, the data is trained and the one with the least mean square error is considered to be the best fit model and can be used for forecasting. The program is executed on a Jupyter notebook.

Output Screens 

Fig: Growth of different types of cases in India

Fig: Confirmed cases Linear Regression Prediction

Fig: Polynomial Regression Prediction for confirmed cases

Fig: SVM regressor Prediction for confirmed cases

Fig: Holts Linear Model Prediction for confirmed cases

Fig: Holt’s Winter model prediction for confirmed cases

Fig: AR model prediction for confirmed cases

Fig: SARIMA model Prediction

System Testing 

In this project, the model evaluation part is very important as by the means of it we can identify which model can best fit the problem.

Here the models are evaluated on the basis of their root mean square error(rmse).

The root-mean-square variance (RMSD) or root-mean-square error (RMSE) is a commonly used calculation of the differences expected by the model or estimator between values (sample or population values) and the values observed.

According to the rmse values of all the models tested in the project, the one with the least rmse value was the SARIMA model. So it can be considered the best fit model for this problem.

Conclusion

 It is concluded that machine learning models can be used to forecast the spread of infectious diseases like Covid-19. In the project, we used various algorithms to forecast the rise of confirmed cases. It was observed among all the algorithms used, SARIMA had the least rmse so it was considered the best fit model for the data that was available.

Limitations

It is a new virus so only a year worth of dataset is available. Generally, the more data we have the better accuracy we get and we have to keep updating the data.

Scope for future work

 It can be implemented such that it can update its graphs or predictions according to real-time values.

Download the Complete project on Covid-19 Outbreak Prediction Using Machine Learning Python Project Code & Report.

Prediction of the growth of Corona Virus Python Project

The upsurge of this disease is CORONA VIRUS has created a life-and-death situation in the world of the living. The virus is increasing day by day and effective lives. Machine Learning can be established very effectively in tracing the disease predicting its growth and forming an effective strategy in order to manage the effect of the virus. This report gives us a full glance and the best mathematical computation with modeling for predicting growth.

In an Corona Virus Prediction ML-based project, we come up with various computations and modeling to suspect or predict the growth of a particular dataset. Although this concept can be used on a dynamic dataset that is changing day to day, here in this report we will study a particular dataset.

Working on the dataset led to various challenges such as modeling different algorithms of machine learning but finally worked on them in order to get the best result. This report is an insight into the working brief of the project such as descriptive information about machine learning, algorithms, statistical description, and most important the programming language used here which is python.

INTRODUCTION

This deadly disease is caused by the spread of various germs and harmful bacteria(pathogens) which transmits from one human to many humans, from one animal to many, and from animal to human. Early diagnoses are curable, while the patients suffering from it with a maximum number of days are not 100% curable.

There is a need for innovation in predicting the growth with deep thorough analysis, of huge global data on the rise of the virus.

The Corona Virus Prediction project comprises two main features or methods we can say, first predicting and analyzing cumulative confirmed cases and then representing with visuals that are data visualization. The second one is predicting the growth of total, confirmed, and new cases and finding accuracy.

  • PRESENT SYSTEM

Many employers are working on the same data and with the same idea of predicting the growth of the virus by analyzing cases. The COVID crisis has led many colleges and students to work in teams to get into a solution against corona.

There are many ongoing types of research and many projects have already been developed in predicting creating awareness on the same

  • PROPOSED SYSTEM

Working on the dataset led to various challenges such as modeling different algorithms of machine learning but finally worked on them in order to get the best result. It is an insight into the working brief of the project such as descriptive information about machine learning, algorithms, statistical description, and most important the programming language used here which is python. 

System Design 

System Flow Chart

Data Dictionary 

Data Pre-Processing: Our dataset needs to be pre-processed. Therefore, data pre-processing is required in this project.

Definition of Training Set: The training set is the data that the algorithm will learn from. Learning looks different depending on which algorithm you are using.

Algorithm Selection: Our project has been implemented using various algorithms such as linear regression, random forest, and decision trees.

Decision Tree: In python, we use a decision tree to observe and figure out the trained data in the structure of the tree in order for any future implementation. Decision Tree, here the target variables take continuous values called regression tree. 

Implementation Work Details 

Libraries used

Numpy

It contains among other things:

  • a powerful N-dimensional array object
  • broadcasting Functions
  • Tools for integrating
  • Useful linear algebra etc.

Pandas

Pandas is an open-source, BSD-authorized library giving superior, simple-to-utilize information structures and information investigation apparatuses for the Python programming language.

  • Benefits:

Python has for some time been incredible for information munging and planning, however less so for information examination and display. pandas help fill this hole, empowering you to do your whole information examination work process in Python without changing to a more space-explicit language like R.

Joined with the amazing IPython toolbox and different libraries, the earth for doing information examination in Python exceeds expectations in execution, profitability, and the capacity to work together.

More work is as yet expected to make Python a top-notch measurable displaying condition.

Download the Complete Project on Prediction of the growth of Corona Virus Python Project Code and Report

Corona Virus Prediction and Analysis Machine Learning Project

1.  Introduction 

Background 

Currently, there are many people, who are being affected by CoronaVirus. It started in China and now it is spreading all over the world. Till now, there is no medicine for this virus, and it’s killing millions of millions of people. So, it is a big question among all of us of how many people are going to be affected.

Problem Statement 

Currently, there is no application that can predict the spread of CoronaVirus for the future 30 days. So, with this project, we would like to create awareness among the people, by showing them how the corona rises for the future 30 days so that they can take some preventive measures by staying indoors.

Project Goal 

The main objective of this Corona Virus Prediction project is :

  • Future prediction of the increase/decrease in the number of active Coronavirus Cases for the next 30 days – for the whole world as well as for the United States of America. We have chosen the USA among all the counties as it is the highly affected country due to corona.
  • Future prediction of the increase/decrease in the number of deaths due to Coronavirus for the next 30 days.
  • Future prediction of the increase/decrease in the number of recovered cases due to Coronavirus for the next 30 days.

2.  Literature Review

 There is an outbreak of Corona in early December. This is caused due to severe acute respiratory syndrome coronavirus 2, which is basically the family of SARS virus. Many governments all over the world are issuing their own preventive measures to control the spread of coronavirus. So, we have conducted a literature review regarding this virus, based on the information that is publicly available.

Background of Literature Review:

China alerted WHO on 31st December 2019 that many people are reported to be suffering from Pneumonia, in Wuhan City. They reported that it started on Dec 8th, 2019, and there were an increasing number of patients who are working or living around the Huanan Seafood Wholesale Market.

When we started working on this project at the start of February, the Coronavirus was majorly prevalent in China. Initially, at the time of our project proposal, the mortality rate in China among all the confirmed cases is around 1.2% as of February 2020. And the mortality rate in all other countries, other than china was around only 0.2%. Among all the patients, who were admitted to the hospitals, the mortality rate, was around 11%. COVID-19 is increasing with great speed, and now there is a relatively very high mortality rate

A Way to Further Research :

So, we have performed this literature review, to analyze the spread of coronavirus. After analyzing how increasingly it’s spreading all over the world, we thought of performing our own prediction regarding this virus, so as to make people aware of its spread, and with this, they can take their own preventive measures, so that they do not fall prey to this dangerous virus.

We had very little amount of data when we started this project. It is a very trending topic all over the world. And millions of millions of people are losing their lives due to this virus. So, we are very curious to analyze this pandemic and so we have taken up this project.

We have found many datasets to collect data regarding the corona cases. Some of them include Kaggle, John Hoppkins, etc. So, we thought of choosing the dataset from John Hoppkins, as it’s updating the dataset on a daily basis. So, we collected the data and performed our own future predictions.

3. Methodology 

Approach

 So, basically, we have followed the below approach to kick-start our Corona Virus Prediction project:

  1. Firstly, we have started with research on choosing the datasets. On performing research on various datasets, we have finalized with John Hoppkins data set, as it gives us the live data on coronavirus.
  2. Secondly, we have collected the data and performed our preprocessing operation, so as to make our data ready for future predictions.
  3. Next, coming to choosing the machine learning algorithm. We have chosen appropriate machine learning(we will discuss below regarding this).
  4. Finally, we have performed our predictions to analyze the active cases, deaths, and recoveries for the next 30 days, based on the data available from the datasets and the chosen machine learning algorithm.

Figure: Approach

4.  Implications 

Benefits of the Project: 

  • This Corona Virus Prediction project helps in the prediction of coronavirus cases for the next 30 days, all over the world.
  • With this, we can also predict the increase in corona cases in the world.
  • By this, we can know how fast the coronavirus is spreading all over the world.
  • We can create awareness among people.
  • We can also create awareness in government so that they can take preventive measures to stop the spread of corona.

Lessons Learned:

Initially, I had no idea of a Machine learning algorithm. I started learning about machines from scratch. I bought some Udemy tutorials and through that, I learned everything step by step. At the start of the project, I am not even aware of what machine learning algorithm to use.

It was really an exciting experience doing this project. I am inspired to take up a Machine Learning Course for my next semester to learn deeply about Machine Learning Algorithms.

I tried my level best and contributed my 100% to this project.

Now, I came to know about machine learning, different types of machine learning Algorithms, and the differences between classification and regression algorithms -when to use what, creating test and train sets, building up the model, choosing the appropriate parameters, and performing future predictions. In the future, I would also love to take up a project related to Classification Algorithms.

5.  Conclusion 

  • Finally, to conclude, we have performed prediction using SVR and Polynomial Regression Algorithm.
  • SVR predictions are mainly for predicting the world case scenario, which includes confirmed, death, and recovered cases.
  • Polynomial Regression is used for the prediction of US Cases.
  • Based on the results, we believe that our predictions were almost accurate, with some little differences from the actual values.
  • This project can be further scalable, to include the predictions for various individual

6.  Appendix 

  • We have used Google Collab for our project. As we are two members of the team, we have chosen this, because it enables us to simultaneously work on the project from different
  • No Installation is Required.
  • We just need to have a google account. And we can easily create a Google Collaboratory file in our google drive, just like Google docs.
  • We will provide both .py files as well as .ipynb files along with this report, so as to run on google collab.
  • .ipynb can be uploaded to google collab directly and the results of the projects can be easily checked.

Predicting Life Expectancy Using Machine Learning Python Project

Project Name: Predicting Life Expectancy Using Machine Learning

Project scope: The scope of this project is ” Predicting Life Expectancy Using Machine Learning” in this project we are given the task to predict life expectancy, life expectancy is the average time period for which the subject lives.

Project schedule: 

  1. Understanding what to do in the above-given Predicting Life Expectancy Project
  2. Identify and get familiar with the tools needed to complete this project
  3. Writing codes
  4. Collecting Data sets
  5. The time duration is 5 days

 Deliverables: 

  1. Predicting Life Expectancy Using Machine Learning.
  2. Making a user interface too as front-end work and writing code as backend work to make the user interact and calculate the Life

Setting The Development Environment

  1. Creating GitHub account
  2. Creating Slack account
  3. Signing up for cloud services
    1. Node-Red for front end
    2. Watson Studio for coding
  • Machine Learning services

1.  INTRODUCTION

  1.1          Overview:

 This project is based on predicting the life expectancy of a person. It is the statistical average of the number of years a person is expected to live. Factors affecting life expectancy are Country, Mental and Physical Illness, lifestyle, diet, health care services, financial condition, BMI, alcohol consumption, Diseases, etc.

Here in this Predicting Life Expectancy project, our motive is to find the life expectancy of a person after providing details such as the country he is living in is developed or is developing, BMI of the person, Disease history, Income, Population of that country, Expenditure, etc. So here I have used Machine learning and Artificial Intelligence to predict life expectancy. The data used in the training of the model was the data by WHO taken from Kaggle.

There were almost 22 columns stating different factors affecting Life expectancy and 2939 rows comprising data of different persons from different countries. Based on the results we got on Watson Studio some factors which were not affecting the Life expectancy much were removed and the scoring endpoint was obtained after running full code. This scoring endpoint is the URL that helps us to send payload data to a model or function development for analysis (such as to classify the data or to make predictions).

After obtaining the endpoint the next step is to work on Node-red which is the platform, we can use for developing our front-end page that will have a form asking you your details such as year of birth, adult mortality, infant deaths, BMI, etc. rest we’ll discuss in details later on.

Requirements: IBM Cloud, GitHub, Slack, IBM Watson, Node-Red

1.2          Purpose:

 The purpose of this project is to build a model that will predict the Life Expectancy of a person after giving the details of the BMI, Expenditure, Disease history, etc.

2.  Literature Survey

2.1          Proposed Solution:

 The project tries to create a model based on data provided by the World Health Organization (WHO) to evaluate the life expectancy for different countries in years. The data offers data on different person’s Physical health, Mental health, etc from the time frame 2000 to 2015. The data was taken from the website: https://www.kaggle.com/kumarajarshi/life-expectancy- who/data. 

3.  Theoretical Survey

 3.1          Block diagram


Block Diagram for Predicting Life Expectancy with Python

3.2          Hardware/Software Designing:

·       GitHub

GitHub is the largest community of developers in the world with millions of people sharing their projects, and ideas for benefiting many people in a very unique way. Any person living in any corner of this world can access this platform for his/her benefit. They can share their problem, their ideas, and solution to some problems. In simple words, it is basically a platform in which anyone can come and share their problems and solutions. It is easy to manage. A team working on the same project can easily monitor the progress and can easily access their work anywhere.

·       Slack

It is a messaging tool that is intended to contact your internal team easily. As it gives you a platform through which we can communicate to our team members easily under one roof. It is not as hectic as sending emails and reading them. It directly comes as a message to you from the group created having your team members. It is great if you are having a team of more than 2 members. Searching for messages becomes an easy, fast medium, searching old messages.

·       IBM Cloud

It is the platform that enables us to use its various features such as Watson Studio which provides a platform where we can write our python code and observe our results in the form of heat maps, graphs, and tables. In this project, we used it and got our scoring endpoint. It is the URL that helps us to send payload data to a model or function development for analysis (such as to classify the data or to make predictions).

·       Node-Red

Node-Red helps us to create a front-end window on which we can get the data from the user such as his Year, BMI, Alcohol intake, etc. and it will then connect to the code written on Watson Studio via the scoring endpoint created after running the python code.

4.  Experimental Investigations

 The graphs of various Factors affecting the prediction of life expectancy are shown in the figure given below:

Curves of life expectancy v/s different factors

Heat map of different factors

Shown above is the heat map of the various factors affecting other various factors some of them have positive values some of them have negative but the thing we have to keep in mind is that we can’t neglect the factors having negative values because they will have the adverse effect which will affect the life expectancy. After some observations, I decided not to include 6 factors that are not affecting life expectancy much and will reduce the calculations and make our model less complex.

5.  Flow Chart

  1. Result

 After filling in all the necessary details asked in the UI form, we got the prediction of life expectancy. The accuracy of our model was 94.41%

Screenshot of the prediction of life expectancy obtained

Advantages and Disadvantages

 Advantages:

  • Easily identifies trends and patterns
  • Wide Applications
  • Handling multi-dimensional and multi-variety data
  • No human intervention is needed (automation)
  • Continuous Improvement

Disadvantages:

  • High error-susceptibility
  • Needs a lot of time to implement
  • Interpreting the results accurately
  • Data set collection is a complex task

Applications 

  1. The form created is easy to understand and is easy to fill by anyone.
  2. It can be used for monitoring health conditions in a particular country
  3. It can be used to get the data about the factor affecting Life expectancy the most in order to work in the direction of obtaining a high life expectancy
  4. It can be used to develop statistics for a country’s development process

Conclusions

This user interface enables any user to predict the life expectancy value of anyone on the basis of the details asked in the form.

Future Scope 

  1. Increase model accuracy
  2. Gives suggestions on how to increase Life Expectancy
  3. Mental health data was missing from the WHO data set which also plays the important role in affecting life expectancy
  4. The scalability and flexibility of the application can be

Airbnb User Bookings Prediction Project Synopsis

Airbnb User Bookings Synopsis

1. Objective of work

The main objective of this project is to predict where will new guest book their first travel experience. 

2. Motivation

This project helps Airbnb to better predict their demand and take consequent informed decisions. Earlier a new user was overwhelmed with the various choices available for a perfect vacation or stay.

By predicting where a new user will book their first travel experience the company is better able to inform its users by sharing personalized content with their community. It will drastically decrease the time to first booking which will increase the company’s output and help them gain popularity among its user and an edge over its competitors in the market. 

3. Target Specifications if any

Predicting where a new guest books their first travel experience. 

4. Functional Partitioning of the project

4.1 Research and gaining knowledge

Undertaking various courses and familiarizing ourselves with the working process of Data Science problems. Exposure and exploration of the Kaggle website, understanding kernels, and datasets. Learning the prerequisites: programming in Python, and Pandas along with Machine Learning algorithms and data visualization methods.

4.2 Frequent Discussions and Guidance

Frequent discussions with our mentor along with his guidance in the same will allow us to work in the right direction and take informed decisions.

 4.3 Applying the knowledge gained

After much exposure to this field and gaining the knowledge, we will now apply our skills to real-life problems and contribute to society.

5. Methodology

5.1 Using the Kaggle platform

In the test set, we will predict all the new users with their first activities after 7/1/2014.In the sessions dataset, the data only dates back to 1/1/2014, while the user’s dataset dates back to 2010. Taking the help of the Kaggle platform for testing out datasets as it is not feasible to have a large dataset say 1TB be stored in a local machine.

5.2 Working on the dataset

 Using the dataset and studying various patterns of users’ first booking after signing up with Airbnb from different countries. Next plot out the observed and collected information. We can then apply various Machine Learning algorithms and calculate prediction scores. Finally, choose the algorithm with the highest score to recommend to users which are from that country the destinations that have been frequently used by travelers belonging to that region.

5.3 Submitting our work on the Kaggle platform

The result can now finally be uploaded on the platform and be used by Airbnb to better connect with their users.

6. Tools required

6.1 Kaggle Kernels

Kaggle is a platform for doing and sharing Data Science. Kaggle Kernels are essentially Jupyter notebooks in the browser that can be run right before your eyes, all free of charge. The processing power for the notebook comes from servers in the cloud, not our local machine allowing us to experience Data Science and Machine Learning without burning through the laptop’s battery and space.

6.2 Dataset

Airbnb will be providing us with the dataset, which would contain: Airbnb will be providing us with the dataset, which would contain

  • csv-the training set of users
  • csv-the test set of users
  • csv-web sessions log for users
  • csv-summary statistics of destination countries in this dataset and their locations
  • csv-summary statistics of users’ age group, gender, and country of destination.
  • csv-correct format for submitting our predictions

7. Work Schedule

(a) January

Enroll and start the course on Machine Learning using Kaggle. Start recapitulating the basics of Python and its various libraries such as NumPy, pandas, etc.

(b) February

End course and start analyzing the dataset

(c) March

Start coding and implementing various algorithms for the prediction

(d) April

Pick the final algorithm by trial and test and finish coding

(e) May

Appropriate documentation and upload our solution

Detection of Currency Notes and Medicine Names for the Blind People Project

OBJECTIVE:-

We have seen blind people facing many problems like fake Currency Notes Detection in our society. So, we have come up with some solutions for some problems they face. As they are blind, they are not able to read the medicine’s name and they always depend on another person for help. Some people take advantage of their disability and cheat them by taking extra money or by giving them less money. And by this Currency Notes Detection project, we are making them independent in terms of medical benefits.

METHODOLOGY: –

To overcome the problem of blind people we have come up with an innovative idea, where we are making use of machine learning, image processing, OpenCV, text-to-speech, and OCR technologies. To make their life comfortable.
In this Currency Notes Detection project, we are using a camera for getting the input, where the inputs are pictures of medicine and currency. These images can be manipulated using image processing and OpenCV. Once the processed image is obtained then it is cropped and thresholding is done, In the next stage we will extract the name of the medicine, then we will convert that text into speech using text-to-speech technology.

Similarly, we will also take pictures of currency, and then by using image processing and machine learning we will compare the picture with a predefined database of the currency that we have already prepared. The next process will be to convert the value of currency into text and then the text is converted into speech using text-to-speech technology.

Block Diagram: –

Technology Used:

  • Image Processing: To extract necessary information
  • OpenCV: To threshold image, color shifting, scanning, and cropping, setting grey level, and extract contours
  • Python 3: To set up the environment and interact with devices
  • OCR (Optical Character Recognition)
  • Machine Learning: Handwritten data is trained in a classifier to process manual marks awarded.

Results

The Detection of Currency Notes and Medicine Names for the Blind People Project can help the blind person in the detection of currency notes and medicine names. By this, the blind person would take care of himself without the help of any caretakers. This would make their life easier and simpler. The talk-back feature used would help them to access the application easily without any complications.

  • This project would help blind people to detect the proper currency that they have received or which they need to give without being cheated for receiving the wrong currency or by avoiding giving the wrong currency. This would make them economically stable and strong
  • Not only in currency detection but also this project would help blind people to recognize the name of the tablet and also help them to know how many dosages they need to take as per the name of the tablet.

This Currency Notes Detection project would help blind persons both in an economical way and in the perspective of health. This would make their life easier and make them confident.

Applications

  • Blind persons will be able to recognize the correct currency without getting cheated in any type of money transaction.
  • Blind persons always need not be dependent on others to know which medicines they need to take at a particular time.

Advantages

  • This project will work on mobile phones only no need to buy any extra things.
  • This work is implemented using TalkBack for android and Voiceover for iOS which means blind people can easily access the application.
  • Easy to set up.
  • Open-source tools were used for this project.
  • Accessible to all devices irrespective of the OS.
  • Cheap and cost-efficient.

Disadvantages

  • It is very difficult to determine whether the currency is a fake one when it is an exact copy of the real currency.
  • For the medicine part, the image should be taken from any side where the name of the medicine is written.

Conclusion

This work shows how visually impaired people (blind persons) can protect themselves from getting cheated in terms of money transactions and also how to reduce the dependency on other people to take the right amount of medicine at the right time Whenever the blind person takes the image using his phone camera the image will be compared with the data set which is created.

After comparing the image if it gets the accuracy above the threshold value then it will give the spoken feedback to the person by saying the value of the currency Similarly in the case of medicine detection extract the name of the medicine and gives the spoken feedback as how many times that person needs to take the medicine, thus making this work as one of the assistants for a blind person.

Future Scope

• Include the data set of photos that contain a person’s images it can also be used to detect a person who has a blind person meets.
• It can also be used to track the blind person using GPS