Results and Analysis
Introduction
Evaluation of results is done in this chapter and all the scenarios created across this simulation are differentiated and compared against the performance metrics used to get the results as discussed in the previous chapter. As discussed in the design and simulation procedure chapter, there are two scenarios in this simulation process and the main aim of this project is to evaluate the security threats across the wireless LAN and for this purpose a simple MANET is considered along with the wireless LAN mobile workstations and the wireless LAN server as discussed in the previous chapter. Few performance metrics with respect to all the applications like voice, video, FTP and wireless LAN are evaluated against the comparison results and the actual results got after running the simulation are analyzed in this chapter along with the graphs as shown below
Results against FTP performance metrics
Three applications are used in this simulation and they are FTP, Voice and video and few performance metrics are also used against the analysis process and in this section the actual results achieved for the FTP against the comparison of both the scenarios is considered. As discussed the first scenario deals with the normal and unsafe wireless LAN settings and the second scenario deals with the secured wireless LAN metrics and they are compared using the simulation graphs and they are as given below
Traffic received in bytes per second
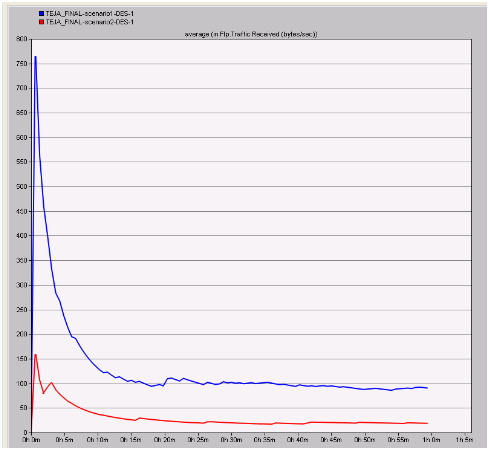
Traffic received in bytes per second can be used to estimate the total count of bytes sent across the wireless LAN server due to the changed metrics in the second scenario and these values are compared with the normal settings and the respective graph that was obtained is as shown below
In the above graph the blue line indicates the actual traffic received due to the unsafe wireless LAN scenarios and the red line indicates the modified and secure wireless LAN scenario. When these lines are compared in the graph it is clear that less amount of traffic is received across the safe wireless LAN settings when compared to the normal scenario. From this indication it can be analyzed that the overall traffic is reduced by changing the settings of wireless LAN and if the total traffic reduced across the network, then the nodes across the network will generate ample packets to the server without any loss and when the first scenario is considered there is more traffic and a maximum value of 750 bytes per second is observed. This value is much greater than the modified scenario where the maximum amount of traffic received is only 150 bytes per second and this indicates that if secure wireless LAN parameters are used, the congestion can be reduced a lot across the network.
Traffic received in packets per second
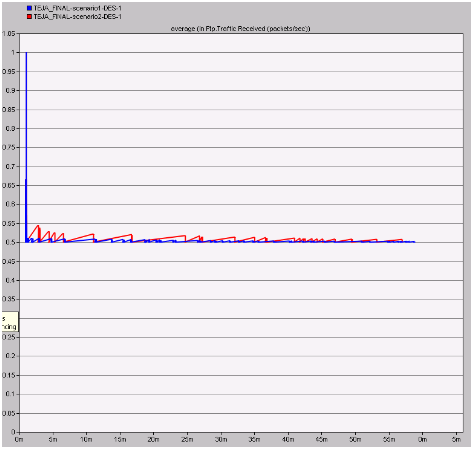
The actual number packets sent across the network indicates amount of flooding across the network and in this process the total traffic received across the network in packets per second for both the scenarios is analyzed and the corresponding graph obtained is as given below
From this graph it is observed that more packets per second are received across the normal scenario when compared to the modified scenario. This analysis can be done such that if there is more traffic received across the network in terms of packets, it indicates that there are chances for flooding and this situation can be eliminated with the implementation of secure wireless LAN parameters. When the second scenario is observed it is clear that a constant rate of traffic is received throughout the simulation process and this value is very less and also the chances for packet flooding is very less.
Traffic sent in bytes per sec
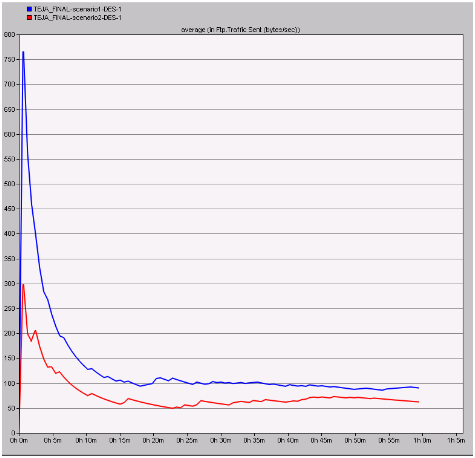
Traffic sent indicates the actual traffic sent by the nodes across the MANETs to the destination wireless LAN server. If the traffic sent is more from the nodes it indicates that the communication is unsafe and need a secure way of sending the traffic at a constant rate and in this context the results obtained for both the scenarios is as given below
From this graph it can be observed that the traffic sent is less with the secure wireless LAN setting when compared to the normal settings scenario. If the traffic sent in bytes per second is low it can be understood that the chances of network congestion are low and this fact is proved with the secured wireless LAN settings and the actual traffic sent with the normal wireless LAN is more when compared to the secured scenario.
Traffic sent in packets per second
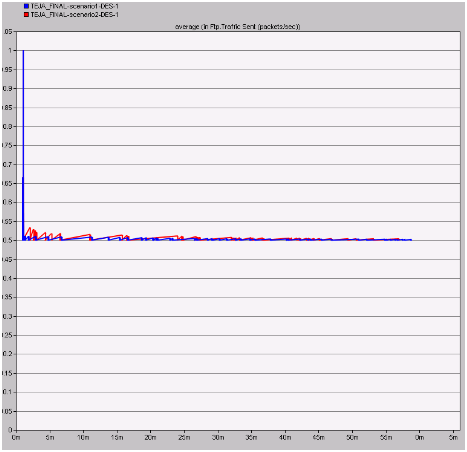
If more packets are sent across the network by the nodes, then it indicates that the nodes are behaving like the attackers and in this process the actual number of packets sent per second for both the scenarios are analyzed and the resultant comparison graph is as shown below
The average amount of traffic sent in packets per second across the two scenarios is given in the above graph. From this graph it can be observed that a very less number of packets are sent across the network by the nodes towards the wireless LAN server and also across this situation the server will be free enough to handle all the client requests and thus the overall congestion on the network can be reduced a lot due to the secure wireless LAN parameters.
Results against video metrics
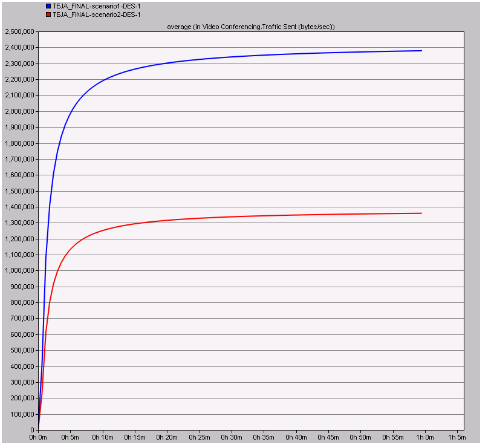
Voice metrics are also used in this results analysis process and only one performance metrics is used in this context and the corresponding graph is as given below. Total traffic sent in bytes per second is analyzed to understand the total amount of traffic sent across the network by both the scenarios is analyzed and the resultant graph is as shown below
From this resultant graph it is observed that the total traffic sent is low with the secure wireless LAN parameters when compared to the normal LAN settings. If the traffic sent by the video application on the network is low it can be concluded that congestion on the network is reduced and also the packet flooding can be minimized when compared to the unsafe wireless LAN parameters.
Results against Voice application
Results obtained after comparing the scenarios against the voice metrics is given in this section and the resultant graphs are also shown. Important metrics are used in this context to evaluate the performance of the secure wireless LAN metrics and they are as shown below
Jitter
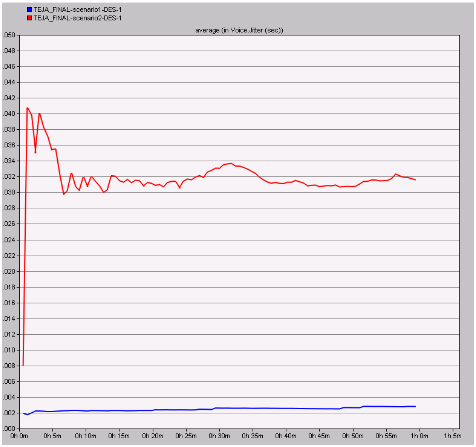
Jitter can also be referred as the packet delay variation and this value indicates the delay of the packets being sent across the network and if the jitter is more the packet are sent at a constant rate and the actual comparison graph obtained in this context is as given below
From the above resultant graph it can be observed that the jitter value for the modified wireless LAN scenario is more when compared to the normal scenario. From this value it can be understood that the jitter is more with the secure wireless LAN configuration and it indicates that the packet are sent at a constant rate without much delay where the normal scenario has very less jitter and thus the packets are sent with more variation in delay terms and even in this perspective the performance of secured wireless LAN scenario is better when compared to the normal scenario.
MOS value
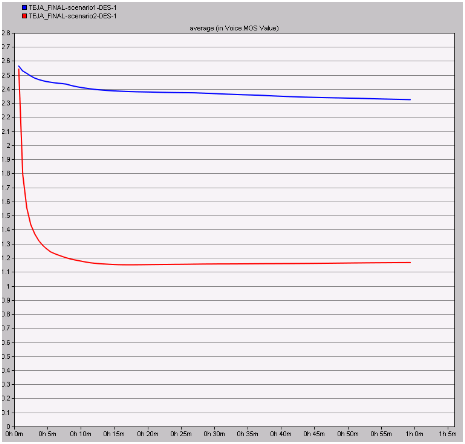
MOS value indicates the quality of the voice application and it should be less enough to ensure more quality. In this context the MOS values are compared for both the scenarios and is given in the form of resultant graph as below
From this graph it can be observed that the MOS value is constant and also less with the secured wireless LAN configuration when compared to the normal configuration. From this analysis it can be concluded that the quality of the voice application is improved and maintained at a constant rate across the secured wireless LAN when compared to the unsafe wireless LAN.
Packet end to end delay in seconds
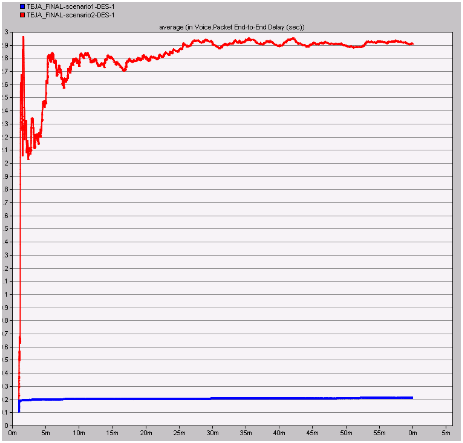
Packet end to end delay is used to measure the actual delay in sending the packet to the server and if this value is more then it indicates that packets are sent continuously across the network and the resultant graph after comparing the scenarios is as given below
The average packet end to end delay is more with the secured wireless LAN configuration when compared to the normal configuration. From this it can be understood that the delay is more with the secure wireless LAN configuration and it sends the packets at a slow and constant rate such that there is no packet loss across the network, where the delay is very less with the unsafe wireless LAN and this indicates that packet flooding is achieved across the network and there is ample scope to lose the packets against the wireless LAN server.
Traffic sent in bytes per second
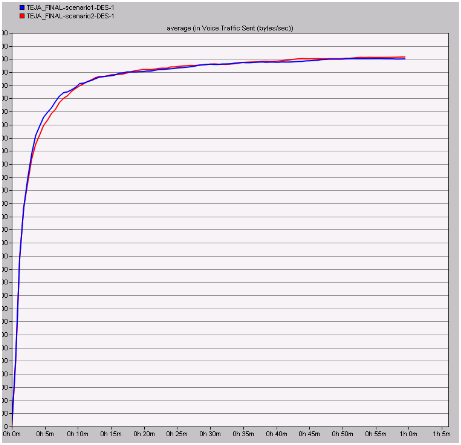
The actual amount of traffic sent in bytes per second is shown in the below graph after comparing both the scenarios
Almost same amount of traffic is sent across the network for both the scenarios and on a while the overall traffic sent is less with the secure wireless LAN parameters. From this it can be understood that the voice application are more open to the attacks and thus the traffic sent is equal even a secure wireless LAN is implemented and a better optimization is done with enhancing the security of the wireless LAN performance metrics.
Results against the WLAN metrics
Wireless LAN metrics are the important metrics used across the simulation and result analysis the resultant graphs obtained after comparing these metrics is as shown below
Delay
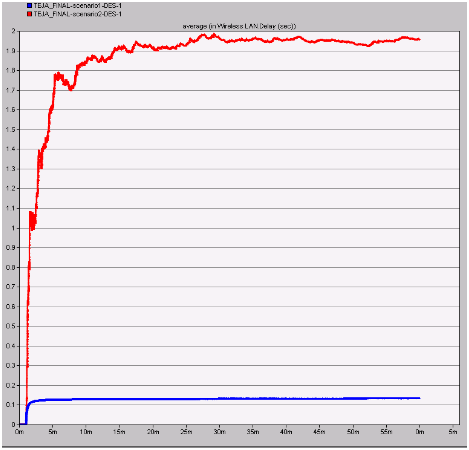
Delay on the wireless LAN server is evaluated in this section and if the delay is more on the server it indicates that the packets are sent at constant rate and the corresponding flooding is eliminated. The resultant graph of both the scenarios is shown below
From this graph it can be observed that a maximum delay is incurred with the secure wireless LAN configuration when compared to the normal configuration. This indicates that if the delay is more means the wireless LAN server is free enough to handle the packets sent from the corresponding clients and also they can be processed accordingly to their own destinations without any loss in packets. The delay with the normal configuration is very less and this situation will make the wireless LAN server busy and it will lose the important data packets sent from different applications.
Medium access delay
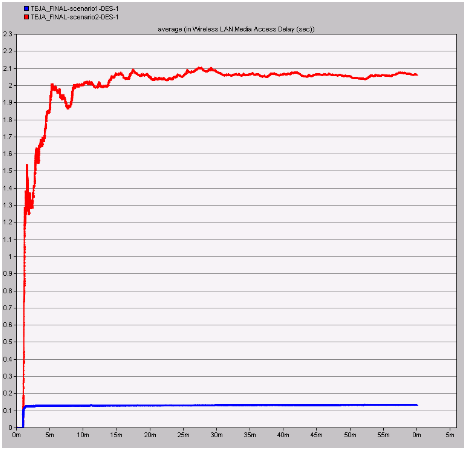
Medium access delay is the important metrics and this value is should be high enough such that the communication patterns are worked as per the defined situations and the resultant graph is as shown below
From the above graph it can be observed that the delay is very less with the normal wireless LAN conditions when compared to the secure wireless LAN. This indicates that the secured wireless LAN parameters are giving ample freedom to the medium in accepting all the networking requests from the corresponding nodes and also the medium can add more nodes and servers with the security provided by the wireless LAN metrics.
Network load
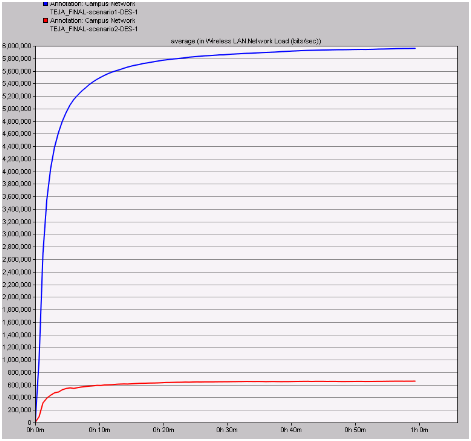
Network load plays an important role in estimating the overall performance of the network and in this context the actual load on the network from both the scenario is estimated and the resultant graph is shown below
Load on the network is very high with the normal wireless LAN metrics when compared to the secure wireless LAN. From this indication it can be understood that, if the load on the network is more due to the unsafe wireless LAN the rest of the nodes stop working and thus the secure wireless LAN metrics are helpful in reducing the load to a maximum extend and even in this context secure wireless LAN performance is more when compared with the ordinary LAN configurations.
Summary
When all the scenarios are compared against the performance metrics used, it is observed the performance of the secure wireless LAN is high when compared to the normal wireless LAN configuration. Key aspects like FTP, Voice, Video and Wireless LAN metrics are compared against the scenarios and across all the comparison process the secure wireless LAN parameters has imposed an optimal conditions on the network in terms of routing, traffic sent, traffic received, jitter, load and delay. From this indication it is understood that if the parameters of the wireless LAN are changes to ensure the safety across the network then the overall performance of the network is improved a lot across any application used in the network. Secure wireless LAN settings has ensured a optimal packet delivery ratio, reduced the congestion on the network by minimizing the traffic sent and received across the nodes and thus it is proved that wireless LAN performance is optimized with the required security considerations.

