
Simple 2D Graph Plotting Abstract
Simple 2D graph plotting is a mini-project implemented on C++ platform to plot two dimensional graphs. The main module used in the program is ‘graphics.h’ which includes various predefined functions to achieve drawing lines, circles, and mouse applications.
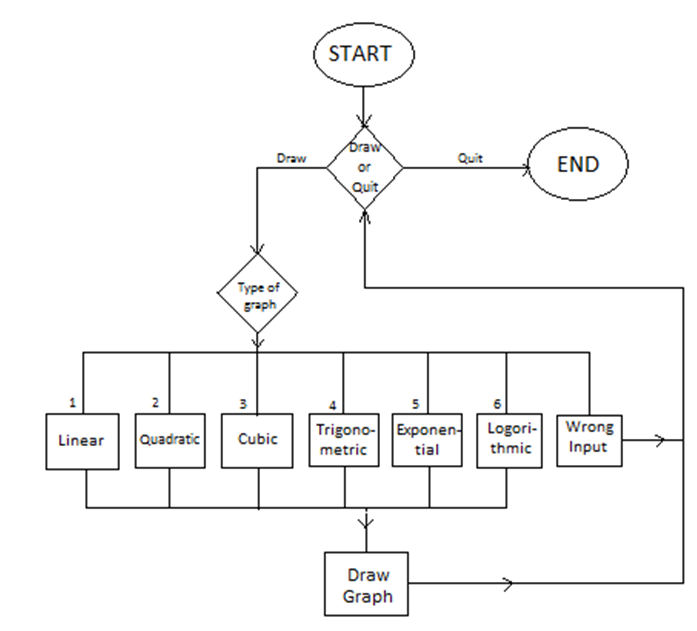
We can include two separate graph plot data in a single plot data object. We can also initialize the plot data objects with the range of the graph to be viewed. While calling the plot() function we also have an option to give different colors to different graphs. The axes are automatically constrained to the range of the graph. But some functions will also be provided to extend the axes span.
Motivation
Mathematics is a common subject that we keep learning right from our kindergarten till higher studies which includes many equations which can be represented graphically. The graphs of the equations are used to analyze and solve the equations. The main idea behind the Simple 2D graph plotting application had taken birth when we ourselves had faced the problem to draw the graphs of any given mathematical equations to solve them. So we have designed an application that takes the mathematical equation as input and displays the graph in Cartesian plane.
Objective of the Project
The main Objective while implementing this Simple 2D graph plotting application was to simplify drawing graphs of any mathematical equations and thereby the analysis of those mathematical equations is made easy by judging their respective graphs.
Tools
This Simple 2D graph plotting application has been totally developed on the C++ platform by using ‘graphics.h’ exclusively for the implementation of Graphical User Interface. The IDE we used was Dev C++. The application can be run on any computer with basic specifications.
Conclusion
Using this Simple 2D graph plotting application will make life very simple for students who study Mathematics mainly for higher studies of Mathematics, Physics, and Chemistry. Various concepts and phenomena in Physics and Chemistry are explained mathematically and represented graphically. In each and every such concept or phenomenon this application is useful which displays the graph by taking the mathematical equation as input.
The main Objective while implementing this Simple 2D graph plotting application was to simplify drawing graphs of any mathematical equations and there by the analysis of those mathematical equations is made easy by judging their respective graphs. We designed the program in such a way that it perfectly matched our objectives.
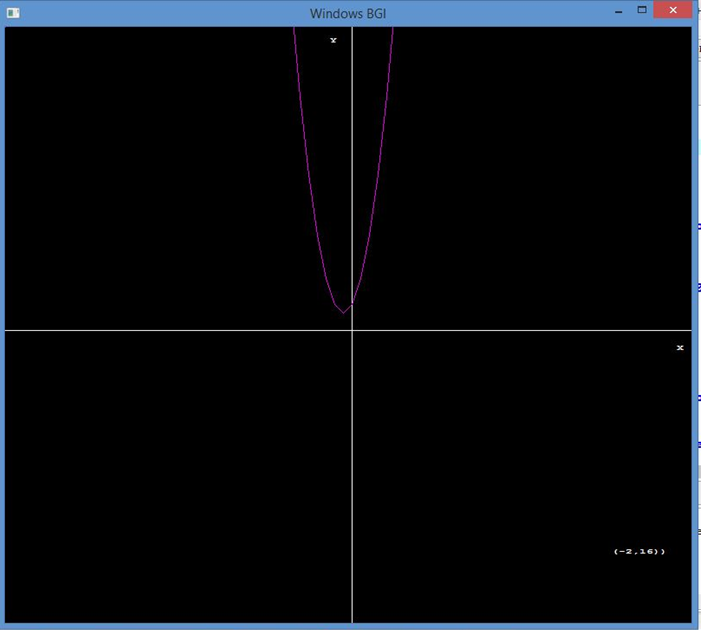
The below figuare shows Graph of a Quadratic Equation
Future Scope
The next version of this Simple 2D graph plotting application will have many more features like :
- Two different graphs can be drawn and compared at a time.
- The front end of the application can be designed in a web page.
- The application can be made usable online.
- The application can be released in Android version.
Download the Simple 2D Graph Plotting C++ Mini Project Source Code & Report, PPT.
Here you can view the developers page to get more details.