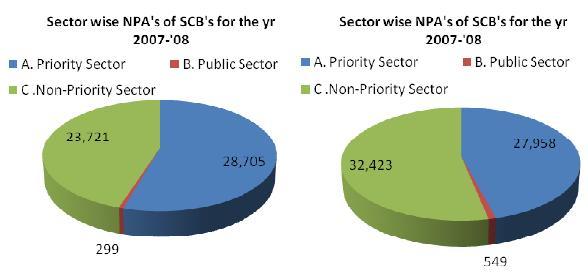
Banks mainly lend to three sectors they include priority sector, public sector and non-priority sector. The lending composition of Indian banks during the last two years is depicted in the following table.
TABLE NO: 1SECOR WISE NPA’S-BANK GROUP-WISE (AMOUNT IN RS.CRORES)
| Sector | public sector old private sector 2007-08 2008-09 2007-08 2008-09 |
Private sector
2007-08 2008-09 |
All SCB
2007-08 2008-09 |
|||||
| A. Priority sector | 25,287
(0.8) |
24,318
(0.7) |
1,338 (0.7) |
1,233
(0.50) |
2,080
(0.3) |
2,407
(0.3) |
28,705
(0.7) |
27,958
(0.5) |
| i)agriculture | 8,268
(0.3) |
5,708
(0.2) |
243
(0.1) |
263
(0.10) |
1,225
(0.2) |
1,178
(0.2) |
9,735
(0.2) |
7,149
(0.21) |
| ii)small scale industries. | 5,805
(0.2) |
6,984
(0.2) |
359
(0.2) |
307
(0.2) |
292
– |
363
– |
6,456
(0.2) |
7,654
(0.2) |
| iii) Others | 11,214
(0.4) |
11,214
(0.3) |
737
(0.4) |
663
(0.3) |
563
(0.1) |
866
(0.1) |
12,514
(0.3) |
13,155
(0.3) |
| b.public sector | 299
– |
474
– |
–
– |
–
– |
–
– |
75
– |
299
– |
549
– |
| c.Non-prority sector | 14,163
(0.5) |
19,251
(0.5) |
1,219
(0.6) |
1,839
(0.8) |
8,339
(1.1) |
11,334
(1.4) |
23,721
(0.6) |
32,423
(0.6) |
| Total(a+b+c) | 39,749
(1.3) |
44,042
(1.2) |
2,557
(1.3) |
3,072
(1.3) |
10,419
(1.40) |
13,815
(1.7) |
52,725
(1.2) |
60,930
(1.2) |
SOURCE: RBI report on trends and progress of banking in India 2008-09. Figures in bracket indicate percentage to total assets of the respective bank group. The analysis of the table shows there was NPA increase in rupees, the percentage of NPA to total advances was almost the same. The reason for this was the one-time loan restructuring measures adopted by RBI. The observation of the table further showed that NPA of all scheduled commercial banks (SCB) for non-priority sector was more when compared to other sectors during the year 2008-2009.
The figures shown above indicate that NPA for priority sector and non-priority sector were more. Public sector loans had least NPA

