Finding Missing People Using Image Processing

Title of the Project: Finding Missing   People Using Image Processing

Domain: IMAGE PROCESSING

Abstract One main objective of the project is to develop a missing children (people) find application that can be helpful for the common people whose beloved ones have been abducted missed, or rescued by the people.

In this Finding Missing People Using Image Processing application or website we provide person with entire data base of the missing children, so that the police can track about the whereabouts or file a case pertaining to the issue.

And the children found (known or unknown) details are uploaded by the police or by an appointed agent.

Entering details of the children like height, age, etc is a lengthy process and the search output is not efficient.

So to avoid this ambiguity we use image processing technique here, a person can upload a picture of whose information is to be known.

This Image will be mapped or compared with the images in the database and case details status etc can be displayed.

The time efficiency is more and output is also efficient.

Healthcare Hospital System Java Project

The main goal of the Healthcare Hospital System project is to view the hospital statistics by Directors and management or by those who are authorized to see it. Information included in this project is all users registration, payments,  consultation statistics, pharmacy, surgery, transplants, equipment’s, patients and doctors, healthcare bill, multi valued diagnosis, preventive health care, corporate counseling, welfare programmers, claims administration, patient care co-ordination, doctor achievements, staff details and Human Resources.

The attributes  included  in the hospital system are street address, city, county, zip code, birth date, admission/discharge dates, date of death, social security numbers,  record numbers, health plan beneficiary numbers, account numbers, telephone numbers, fax numbers, e-mail addresses. As the information about the patient is already stored in the database, it is easy to retrieve back and to identify the concerned doctor to the patient.

The best way to achieve cost goal is to analyze and interpreting the data and to produce visualization reports.

Project Requirements and Thoughts

  • Identify a topic of interest and run with it!
  • Identify a topic of interest and run with it! Pick a topic that will keep you interested and motivated over the next 14 weeks.
  • Ask the following question: Which answers am I trying to mine or solve?
  • Formulate a hypothesis question. Additional hypothesis questions are encouraged (maximum of 3 questions) are encouraged.  A hypothesis question contains both a null and alternative question.
  • What kind of data is being mined?  Where does the data originate? Can the data be imported into a database (i.e. for formulating updated queries).
  • List Class and/or Concepts related to characteristics and discriminations.
  • Is you project identifying patterns, associations, and/or correlations.
  • Within the project, statistics (e.g. central tendency, range, IQR, variance, etc.) should be presented.
  • Does your dataset contain outliners, if so, please identify them.
  • Projects should list attributes (e.g. nominal, binary, ordinal, and/or numeric)
  • If possible, data should be presented visually (iPython, R, MatLab, Excel, etc.).
  • Was the collected data consider of good or poor quality?
  • Does the data contain missing values or noisy data?
  • Does the dataset contain redundant data? If so, how did you remove duplicated values?
  • When analyzing the data, did you perform OLAP or OLTP processing?
  • Which data models were used for your project (e.g. Stars, Snowflakes, or Fact Constellations)?
  • If OLAP processing was used, did you incorporate bitmap or join indexing into the processing?
  • Did did you determine the size of your data set?

Educational Products Suppliers Project in Java

Business Idea:

The main goal of Educational products suppliers project is to collect all the educational products and place them in to single website and sell them through online.

Nature of the project/ Process of Purchase:

Collecting all the products those are like books, charts, Puzzles etc., which comes under stationary. We have to collect and maintain the information about the products in data bases. Update information regarding products based on their versions of books. Developing the e commerce website this website must contain the information of products. User can see the products and they can buy them through online. Here they have the sign in and log in forms.

First user want to enter in to website by using the URL. After that they want to login to their account if they are already member if not they have to register first. Once login with their credentials the entered data is checks with data which is already in database, if the information is correct they can renders in to home page then they can see all the products. User have the access to select the products and can add to the wish list or they can buy through their cards by entering the necessary information. And user should also provide their shipping details for delivery.

Budget information:

Technologies and requirements used to develop the website and to meet the user requirements. The project should solve the business issues and should satisfy the user requirements. Economic feasibility says about the budget information of the project. The project should capable of generating the profit to the organization. This is mainly depends upon cost of products which we have buy from publishers, manufactures and from retailers. Budget should also depends upon software, hardware, and other technical tools and databases we used to develop the website.

According to our estimation it may cost 5,000 /- to 10,000 /- based up on all the specifications and requirements. It may vary if the business grows higher.

Issues and Risks:

There may be chances of slow down the server. Sometimes there is a chance of mismatch of information of products. There may be a chance of arising the security issues regarding user information. And delivery issues.

Presence Strategy:

The main goal of Educational products suppliers Final Year Project is to collect all the educational products and place them in to single website and sell them through online.

  • Collect all the products from manufactures, book publishers, retailers.
  • Collect all the information regarding the products.
  • Store all the information in databases. So that we need servers.
  • High level business requirements, specifications needs to develop the projects.
  • Maintaining the security to user information.
  • Proper arrangements of products based up on their priority and updating versions.

Vision:

This Educational Products Suppliers project should meet all the user needs that are required to buy the stationary. Creating the user friendly environment.

Mission:

Developing the Educational Products Suppliers e commerce website based up the requirements gathering and information of the products.

Target Audience:

Site maintainers, site users, product maintainers, product buyers, suppliers.

Intended market space:

Market space is nothing but where the site is in use.

Main Project Success Criteria:

Based upon collection of requirements, Analysis,Proper designing, implementation and providing a full extensive report including detailed financial analysis and recommendations how to implement the project.

Business statement, high level business requirement, specifications, developers, integrating, data flow, screen flows, user accepting testing, quality assurance,

Approach:

  • Collecting all the functional and non-functional requirements.
  • Analysis of all the requirements,
  • Allocate work to group of people who can work full time on project.
  • Maintaining the healthy relationship between the designers, developers, and data collectors.
  • From a group of people to collect all the products. And maintain those product information in databases.
  • Using and maintaining the company servers.
  • Day to day updates of products.
  • Designing of website by using the unified modelling languages.
  • Select the skilled developers to develop the website. These developers use the designing models to develop the website.
  • Make sure of data flow and screen flow.
  • After developing the pages we have to integrate the pages.
  • Providing the security to user information.
  • Once the website is done we have to test the website for page responsiveness and we have to check all the functionalities.

Audience/Users:

The users may be any type of users there is no restrictions in age, gender etc.,

Purchasing habits of user depends upon their needs.

Manpower Acquisition Planning and Employee Recruitment System

 Abstract: This project will be designed and developed for any educational universities or colleges  for making recruitment process. “Manpower Acquisition Planning and Employee Recruitment System” is a web-based tool to reduce communication gap between Placement Officers(Applicants) &  Job Providers(MNC Companies). Especially in fast growing IT market technologies are changing very fast, based on technology trend Organizations has to recruit the people. This process will make recruitment process very easy and fast.

The main objective of this solution is to make easy the recruitment process of any organization. This system is designed by keeping in mind both parties like Colleges/Universities  and MNC Companies. This system allows Placement Officers(Applicants) to register his/her details along with college/university details & to post the student’s resumes based on the opportunities in the companies. And then on the other hand even it allows job providers(MNC Companies) to post their requirements with the system.

This system is an independent module and is a part of the Human Resource Management System. It is a feature rich integrated recruitment package, designed for the desktop. It stores the details of jobs and details of the candidates in the database. It helps in conducting the scheduled interviews.

Existing System

The existing system is a manual one. When the placement officer wants to share the student profiles with MNC companies(Job Providers) to process of recruitment, he has to do everything manually.  And the job providers want to post the job requirements(opportunities), they have to concern the placement officers manually. Process of shortlisting the student’s profiles & conducting scheduled interviews is very tedious.

Disadvantages:

  • Recruitment process is very slow
  • Difficult to handle more colleges/universities for recruitment process
  • Difficulty of maintaining the student’s profiles
  • Communication gap between Job providers(MNC Organizations) and Placement officers.

Proposed System

Manpower Acquisition Planning and Employee Recruitment System” is to replace the existing manual system with a software solution.

This project can be very easily used in the process of decision making in new recruitment’s and it will reduce the amount of time required to complete the recruitment process of any organization. This system will allow the Job providers (i.e. HR department) to post the required jobs(Opportunities) which will be available to University’s/College’s placement officers. Then Placements officers can check the student’s profiles, if matches with opportunities then they will forward the student’s profiles to respective HR department. So this system will allow the Job providers to search from database for suitable candidate for a position based on skill set.

Advantages:

  • Faster processing when compared to existing one.
  • Easy recruitment process
  • Effective way of providing communication between Job providers(MNC Organizations) and Placement officers.
  • Easy maintenance of student’s profiles
  • Effective way of conducting scheduled interviews

Modules:

The project contains seven modules

  • Registration Module
  • User Management Module
  • Employee Management Module
  • Resumes Module
  • Opportunities Module
  • Schedule Interviews Module
  • Results Module

Technologies:

  • Frontend : JSP, Servlets, Java, Java Script, HTML,CSS
  • Database :  MySQL 5.0
  • Web Server : Apache Tomcat 6.0
  • Operating System : Windows 7

Web Based Feedback Management System Java Project

Abstract

One of the most sensible ways of improving teaching is to ask the students for feedback. At the end of each teaching period (semester or term) all colleges ,universities & schools survey their students. Usually these surveys are managed manually by paper work based approach. Paper based approach for students feedback management  is a labor intensive process.We have developed Web Based Feedback Management System to provide feedback in an easy and quick manner to the authenticated users. So we call it as Student Feedback Management System which delivers via the student, staff interface as web based system which acts as a service provider.By using this technology we can make fast feedback about the staffs by students, on time to head of departments as they referred in web based system. This project has two kinds of modules such as student and admin. The student can give feedback in web based system provided by college staff. This feedback report is checked by the admin. They can view grades obtained to the lecturers and give this report to the principal and he conducts counseling to the college staff.

Introduction

Web based feedback management system is a web based application that provides platform for the colleges to conduct student’s feedback. This Web based system is the best place to find feedback report according to the requirement such as feedback given by the various kinds of students and so on and it is the efficient place to get feedback analysis and maintain security. Students will fill the web based feedback form. In this work, security is also maintained. The result of feedback is only visible to authenticated user. Web based feedback is an integral feature of effective and  efficient  learning and teaching. It can be one of the powerful way to enhance and strengthen student learning. Feedback is one of the most powerful influences on learning and achievement, but this impact can be either positive or negative.

Literature survey

Existing system:

In Existing system,colleges are using printed survey paper as the primary mechanism  to collect feedback from students.The paper based  feed back approach is labor intensive  process. A typical survey cycle begins with departmental staff placing orders for survey foams for every section. The office is responsible for printing the foams and sending them to departments. Once the forms are ready upon receipt of the forms, the departmental staffs prepare packets for each sections and deliver the packets to the faculty. The faculty members take survey to their classes and departmental staff members administers the survey. Once the surveys are returned to the department, feedback is evaluated and consider the overall grades and the result documents are included in appropriate departmental files.

Normally, a portion of a regular lecturer session is devoted to the distribution, Completion and collection of the paper based surveys. whether the class sessions in which these surveys are conducted are announced are not. The sample gathered depends on the class attendance for that single session. The processing of these feedback is expensive time consuming prone to error compared to web based approach.

Proposed system:      

The survey of teaching is usually administered at the end of the term, before the final examination. The web based student feedback management system requires very small number of steps that need significant human intervention. The results become available more faster proving opportunity  to administer survey more frequently during the term. The web based feedback management system provides student with a greatest opportunity to complete the survey at there convenience and when they have access to the web. All of the students in the class are have equal access to the web based feedback management application. None of the student loose the opportunity because of being absent from class as they do when the instruct administers the paper based survey. The great advantage  is results from the interim surveys can be used to modify the course materials and teaching methods while the course is in progress. It also reduce the cost and time required to get the feedback and reduces paper work.

Advantages

Revision of frequency

Web based approach offers distinct advantages when institution wants the flexibility of using different survey questions for different courses in web based feedback management system questions can be revised,modified with relative case.

Reduce survey cycle time

          Because the web based feedback management system requires very small number of steps that needs significant human intervention the result become available more faster proving  opportunity to administer survey more frequently during the term.

E-DONATE Java & MYSQL Project

INTRODUCTION: E-DONATE is an organization for the intellectually challenged individuals. E-DONATE website is a medium to publicize the welfare activities of the organization, so that the web users all over the world can access the website via internet and come across the welfare activities done by the organization. Donors can donate by performing online transaction in the website. The donors information is loaded in the database. The user can contact to the organization via E-mail.
PROPOSED SYSTEM: The purpose of our project is to develop a data base which is a comprehensive one in which all aspects of online transactions are covered and donations are made in a secure way. Donors can donate via 3D secure payment  and the details of the donors are stored in the database. The list of activities done by the organization are published on the website so that donors can have trust on the organization that the money donated is utilized in an efficient manner.

E-DONATE website is designed for  the organization ‘E-DONATE’ with an intention to publicize the events and activities and help them get funds.

E-DONATE is an organization for the specially challenged orphan students and   Elders who are physically challenged. The organization takes care of the welfare of its members in all aspects.

E-DONATE website is a medium to publicize the welfare activities of the organization , so that web users all over the world can come across the activities done by the organization and can donate via online transaction.

The intention is to spread awareness about the organization and help them to get funds through the website  through online transaction.

Use Case Diagram

Existing System:

The design for the website is prepared using HTML and CSS.

The website needs to be given advanced attributes such as online transactions  and multimedia  to enhance the quality of the website and to benefit the organization.

The inputs such as activities of the organization and their complete history is added.

Pictorial Information is also added to provide proper support of the activities that are going on in the organization.

Class Diagram

Proposed System:

The proposed system is that, to add the advance features to the website to make it beneficial to the organization.

The intention is to develop a database which  is a comprehensive one in which all aspects of online transactions are covered and donations are made in secure way.

By getting associated with third party sources like paypal , online transaction will be activated in the website so that any person browsing the website can donate the amount.

This funds will be directed towards the organization via net banking or credit card/debit card transactions in a secure environment.

State Chart Diagram

Hardware Requirements:

Processor-        Intel pentium III or higher
Processor speed- 533 MHZ
Ram-            512 mb or higher
Hard disk-        4 gb or higher

Software Requirements:

Operating System:   windows xp or above
Languages: Front end- HTML,CSS ,JAVA,
Back end- Database-mySQL

School Management System Real Time Java Project

School Management System is a Java based Windows Application developed for different Schools and colleges.

Modules included in this project are below:

  1. Admissions Module
  2. Attendance Module
  3. Examinations Module
  4. Staff Management Module
  5. Library Module
  6. Fee Management Module
  7. Accounts Module
  8. Reports Module

Output Screens of this project are below:

Login Page:

Admin and School Management can login through this login Page by entering user name and password

School Management System Login Page

Home Page View

After logged into the system, admin can have able to see and manage all menu options like admissions, attendence, examinations, staff, library, fee, accounts and reports.

Basic page where admin can add student information, Parent Guardian and Academic details

Home Page View
Admissions Page View

Adminssions page has several fields like Admission number, Date, First Name, Last Name, Father Name, Mothers Name, Date of Birth,  Gender, Class, Section, Contact Number, Identification Marks, Fee Perticulars, Date of Payment, Remarks, etc..

Adminissions Page View
Attendance Page View

Attendance Page View
Examinations Page View

Examinations Page View
Staff Management Page View

Staff Management Page View
Library Page View

Here we can manage Library book information with the help of availability of book and issues books.
Book list contains book name, Author, Total number of books, number of books issued, number of books available

Library Page View
Fee Management Page View

Here we can manage all fee details of the students, Can manage & update all students fee details using the below fields:
1) Fathers Name
2) Mother Name
3) Class
4) Section
5) Contact Number
6) Total Fee
7) Paid Term Wise
8) Mode of Payment
9) Payment Due

Fee Management Page View
Accounts Page View

Welcome to the Accounts Page Section:
In this accounts section we can able to manage money related info for books, accesories, salaries and other miscellaneous details

Accounts Page View
Reports Page View

Welcome to the reports Page Section:
Here reports can be generated by using the search option for selecting the class, Name, Roll Number/Lecturer ID, Admission Number or using the search box for internal search.
Once the Search operation is done, we can find the reports to view, upload and print purpose.

Reports Page View

Fraudulent Expenses Detection Java Project

INTRODUCTION:
The purpose of this document is to define scope and requirements of an application to detect anomalies in the expense approval system hosted on the Intranet of a leading business house.

Increasing volumes of the expense claims due to wide operations required controls so that the unscrupulous employees don’t get a chance to forge claims and get away with undue claim re-imbursements.

IT team proposed a tool based on Benford’s law to scan the past approved expense claims and detect potential frauds for further manual investigation using the said distribution.

This document is the primary input to the development team to architect a solution for this project.

System Users:

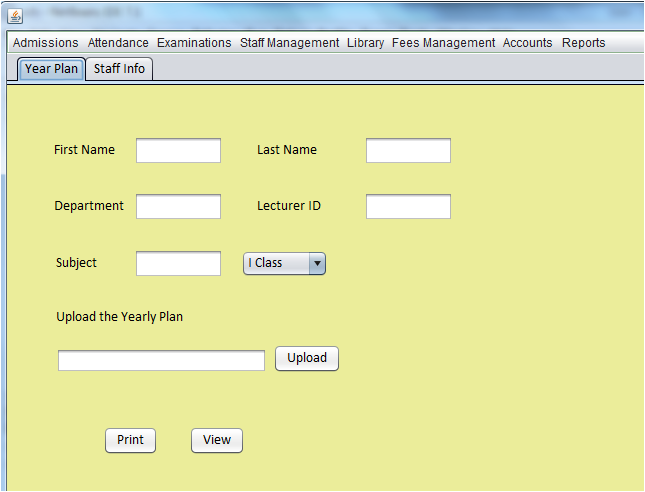
The pre-audit team and the approving managers (supervisors) of expense claim will benefit from using Fraudulent Expenses Detection System, DETECT.

Assumptions

1 . The application will be hosted on the intranet server as part of the expense claim framework. The users will access the application from Audit menu in
the application.

2 . The transaction data of expense claims for at least 6 months shall be uploaded into the system from the backend in CSV format. To simplify the
scope of this project, it can be assumed that each claim has fields viz. (a) claim id, (b) date, (c) employee’s name, (d) supervisor’s name, and (e)
claimed amount. In real life, such data will reside in multiple tables.

3 . Since DETECT is expected to use Intranet’s authentication, for the purpose of this project, entering user name will take you to the user’s DETECT
screen. You may create sample users directly from the backend database

REQUIREMENTS:

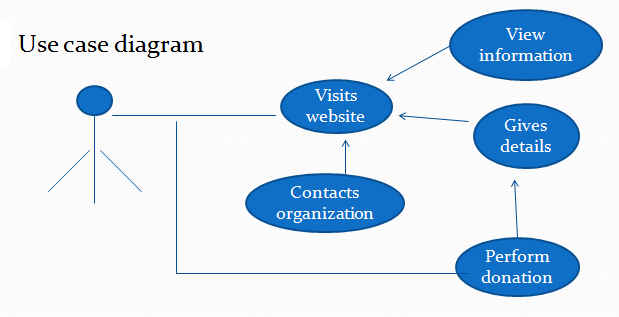
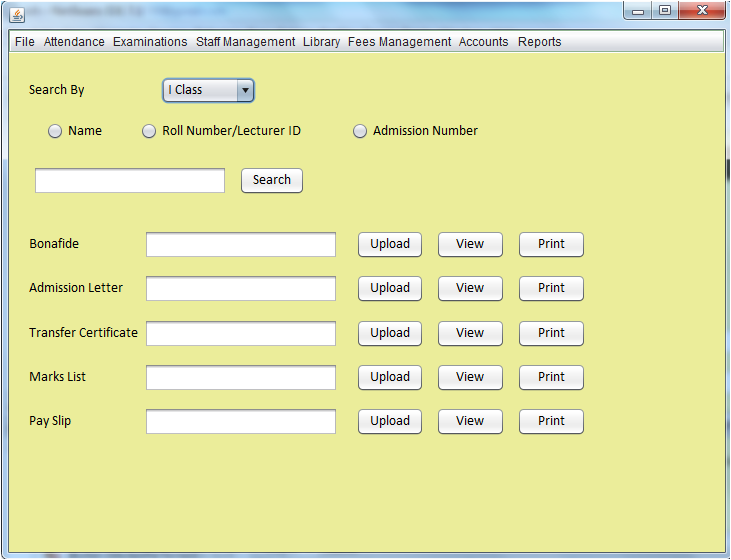
DETECT allows the pre-audit team to run this application for a transaction period.

Basic System Operation

The following steps outline the basic system operation in context of the end-user:

Detect Fraudulent Expense

1 . The system displays list of recently uploaded CSV files. User selects the desired CSV file and clicks on “detect” button.
2 . System alerts if the selected CSV has data for less than 6 months and aborts further execution; otherwise it proceeds to scanning process outlined in step #3.
3 . DETECT scans through all the expense claims from the CSV file. It reads each claim amount and generates a Benford’s frequency distribution.
4 . The system displays the Frequency distribution generated by the application along with the Benford’s distribution and its percentage deviation from Benford’s distribution.
5 . The rows that have more that 5% deviation from the Benford’s distribution are highlighted in Yellow color.
6 . The auditor can flag the Yellow color rows to generate the list of transactions that require validation by the Supervisor. For each flagged transaction, the system automatically builds a supervisor wise index of all such claims.

Investigate Flagged Expense Claims

1 . The system shall notify the supervisors of respective claims that are shortlisted by the application.
2 . The list of all flagged transactions to be reviewed by a supervisor are displayed to him/her by DETECT.
3 . The supervisor clicks on the Claim id to access the complete record. The claim record opens up displaying employee name, type of expense, date,
description and amount.
4 . The supervisor can either mark a claim as “valid” or “false claim”. DETECT removes the valid claims from the index.

False Claims

1 . The pre-audit user can view the claims marked as False Claim by the supervisors.
2 . Action on such claims is taken outside the system.

A user-friendly interface needs to be developed to ensure smooth usage of the system.
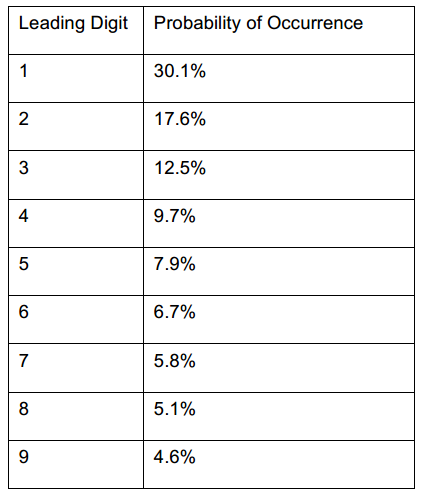
About Benford’s Law

Benford’s law, also known as the first-digit law, it says that in lists of numbers from many real-life sources of data, the leading digit is distributed in a specific, nonuniform way.

The standard Benford’s Distribution is outlined on the next page.

Auditors use this law to find patterns in data where there is a possibility of a fraud.

Such data is taken up for further investigation. Learn more about Benford’s law at http://mathworld.wolfram.com/BenfordsLaw.html URL.

Fraudulent Expenses Detection - DETECT
DEVELOPMENT ENVIRONMENT

DETECT will be developed as a web application using Java/JSP and DB2 database. Eclipse will be used as the IDE for the same. You may consider using a
JavaScript framework like Prototype/ Scriptaculous/jQuery. JSON specifications can be found at http://www.json.org/ URL.

Information Aggregator – Dashboard Java Project

Abstract:

The purpose of this project is to define scope and requirements for an Information Aggregator – Dashboard, to be developed for Top Management in Sales, Product and Merchandise functions of a Retail house. Replacing the traditional flash reports every morning pouring in from various locations. A live dashboard on intranet will provide a status on various metrics that corporate office wishes to monitor.
The dashboard will be a simple snapshot of Category wise revenue, Product Returns and Top Ten Revenue generating products.

This document is the primary input to the development team to architect a solution for this project.
Retail Challenges In retail, the individual product performance is very critical, as their procurement sources could be different, factors like delivery turnaround time, defect piece handling, returns, trendiness, buyer segment appeal determine which products should be discontinued and new items to be introduced. Retail business has to take care of the small time window availability arising from the festive season or otherwise seasonal changes especially in case of merchandise. Study of product sales patterns, buying habits and popularity is vital to success of the retail business.

Just by adding analytics to the daily purchase and billing data empowers a decision maker to roll out realistic plans.

System Users

The Corporate office Management will be users of the Information Aggregator, Dashboard.

Assumptions

1 . Dashboard will be integrated with the Retail House’s intranet, thus use the login and authentication mechanism of intranet only.
2 . On logging in the user gets to view the landing page displaying dashboard.
3 . The dashboards are normally created using data from the core applications in the organization. In the case of Retail houses, the data gets stored on the central server from the Point of Sales (Billing) at each location. In this project, the data feed is coming from CSV files generated by the central database server of the Retail House.
4 . The developer of this tool is expected to read and familiarize with Google Chart tools.
5 . There are two types of charts PIE and Bar Chart being used for creating a Dashboard.

INTRODUCTION:

The Dashboard tool will read data uploaded from back end as per the formats given below and process the data to generate Product Analytics like a sample view provided below.
The Dashboard has 3 sections; you may change the look and feel to ensure best fit of charts that will get integrated using Google Charts API.
The retail house markets 5 categories of products; Apparels, Electronic Goods, Household, Jewelry and Sports & Fitness.
The category wise revenue displays a pie chart of total sales value billed under each category.
Product Replacements section plots the category wise count of items returned under them.
Top Ten Products by Revenue, plots 10 items that have had maximum sales for all the categories by default.

Input Data
The following input data is required to be uploaded as CSV to generate these charts.

REQUIREMENTS
Information Aggregator - Dashboard Java Project
Product Category (Master)
Category id and Category Name

Items (Master)
Category id, Item id and Item name

Revenue Data (Transaction)
Bill Date, Category id, Item id, Qty and Value

Product Return (Transaction)
Bill Date, Category id, Item id, Qty and Value
Tip: While generating output the category name and item name shall come from master tables.

Charts – Must haves
1 . Each chart in the section must have a title, data labels and series title wherever applicable.
2 . On mouse hover, the actual data values be it % or Sales Value is displayed.
3 . User should be able to select the month if required to look at previous data. By default the current months figures till date should be displayed.
4 . For the adventurous developer, you may make the pie chart category selection refresh the page for other sections to display data specific to the pie chart category selected.
Dashboard will be developed as a web application using Java/JSP and DB2 database. Eclipse will be used as the IDE for the same. Knowledge of XML is a must for this project.
Refer to the charts tools from Google to integrate in the dashboard https://developers.google.com/chart/

Vehicle Tracker and Speed Notifier Java Project

Purpose: In our daily life, we find many situations where it is necessary to find the vehicle location . This project targets to develop a mobile application in order to provide vehicle location and it also used to send speed notifications to user. It uses internet and can be accessed from anywhere.

Software Requirements-

  • Java
  • XML
  • Eclipse ADT
  • MySQL

Specifications of the project

  • Location tracking.
  • Sending speed notifications.
  • Basically we need two android applications in which one acts as parent app, another one acts as child app.
  • Whenever a parent application needs his respective child application location then we have to provide location and speed.
  • By saving latitude and longitude values in local server ,we can access child location.
  • Speed calculation like after reaching the destination, Distance/time.
  • We have to write an trigger like if speed reaches 50, then push an notification.

Working Of Vehicle Tracking

By using built-in GPS(Global Positioning System) child     application will send the respective Latitude(X) and Longitude(Y) values through a link to guardian/parent application through Notifications, E-Mail and SMS whenever guardian/parent wants to know their respective children.

Here Guardian/Parent can fix some speed limit if respective child cross that speed limit then guardian/parent will get continuous notifications through the application.

https://www.google.co.in/maps/@X,Y,Zz?hl=en

X is the value of Latitude.

Y is the value of Longitude.

Z is the value of Zoom in google maps.

  • If you click on the above link it will show the location of respective child.