Abstract:
The purpose of this project is to define scope and requirements for an Information Aggregator – Dashboard, to be developed for Top Management in Sales, Product and Merchandise functions of a Retail house. Replacing the traditional flash reports every morning pouring in from various locations. A live dashboard on intranet will provide a status on various metrics that corporate office wishes to monitor.
The dashboard will be a simple snapshot of Category wise revenue, Product Returns and Top Ten Revenue generating products.
This document is the primary input to the development team to architect a solution for this project.
Retail Challenges In retail, the individual product performance is very critical, as their procurement sources could be different, factors like delivery turnaround time, defect piece handling, returns, trendiness, buyer segment appeal determine which products should be discontinued and new items to be introduced. Retail business has to take care of the small time window availability arising from the festive season or otherwise seasonal changes especially in case of merchandise. Study of product sales patterns, buying habits and popularity is vital to success of the retail business.
Just by adding analytics to the daily purchase and billing data empowers a decision maker to roll out realistic plans.
System Users
The Corporate office Management will be users of the Information Aggregator, Dashboard.
Assumptions
1 . Dashboard will be integrated with the Retail House’s intranet, thus use the login and authentication mechanism of intranet only.
2 . On logging in the user gets to view the landing page displaying dashboard.
3 . The dashboards are normally created using data from the core applications in the organization. In the case of Retail houses, the data gets stored on the central server from the Point of Sales (Billing) at each location. In this project, the data feed is coming from CSV files generated by the central database server of the Retail House.
4 . The developer of this tool is expected to read and familiarize with Google Chart tools.
5 . There are two types of charts PIE and Bar Chart being used for creating a Dashboard.
INTRODUCTION:
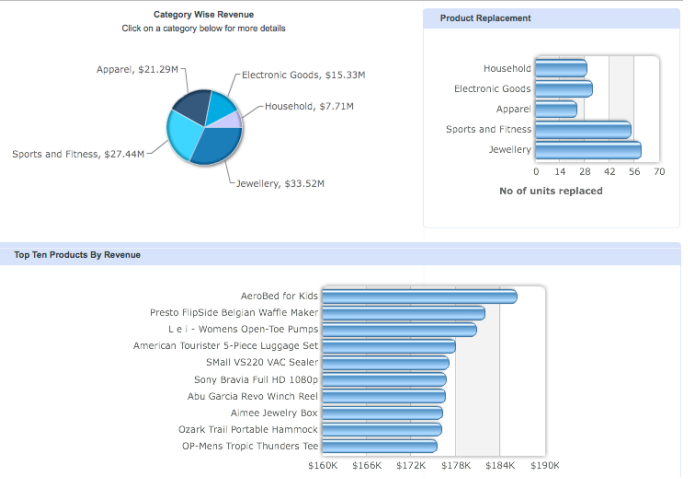
The Dashboard tool will read data uploaded from back end as per the formats given below and process the data to generate Product Analytics like a sample view provided below.
The Dashboard has 3 sections; you may change the look and feel to ensure best fit of charts that will get integrated using Google Charts API.
The retail house markets 5 categories of products; Apparels, Electronic Goods, Household, Jewelry and Sports & Fitness.
The category wise revenue displays a pie chart of total sales value billed under each category.
Product Replacements section plots the category wise count of items returned under them.
Top Ten Products by Revenue, plots 10 items that have had maximum sales for all the categories by default.
Input Data
The following input data is required to be uploaded as CSV to generate these charts.
REQUIREMENTS

Product Category (Master)
Category id and Category Name
Items (Master)
Category id, Item id and Item name
Revenue Data (Transaction)
Bill Date, Category id, Item id, Qty and Value
Product Return (Transaction)
Bill Date, Category id, Item id, Qty and Value
Tip: While generating output the category name and item name shall come from master tables.
Charts – Must haves
1 . Each chart in the section must have a title, data labels and series title wherever applicable.
2 . On mouse hover, the actual data values be it % or Sales Value is displayed.
3 . User should be able to select the month if required to look at previous data. By default the current months figures till date should be displayed.
4 . For the adventurous developer, you may make the pie chart category selection refresh the page for other sections to display data specific to the pie chart category selected.
Dashboard will be developed as a web application using Java/JSP and DB2 database. Eclipse will be used as the IDE for the same. Knowledge of XML is a must for this project.
Refer to the charts tools from Google to integrate in the dashboard https://developers.google.com/chart/

sir,
can you suggest a base paper(of ieee or international journal) for this project.