Project Name: Predicting Life Expectancy Using Machine Learning
Project scope: The scope of this project is ” Predicting Life Expectancy Using Machine Learning” in this project we are given the task to predict life expectancy, life expectancy is the average time period for which the subject lives.
Project schedule:
- Understanding what to do in the above-given Predicting Life Expectancy Project
- Identify and get familiar with the tools needed to complete this project
- Writing codes
- Collecting Data sets
- The time duration is 5 days
Deliverables:
- Predicting Life Expectancy Using Machine Learning.
- Making a user interface too as front-end work and writing code as backend work to make the user interact and calculate the Life
Setting The Development Environment
- Creating GitHub account
- Creating Slack account
- Signing up for cloud services
- Node-Red for front end
- Watson Studio for coding
- Machine Learning services
1. INTRODUCTION
1.1 Overview:
This project is based on predicting the life expectancy of a person. It is the statistical average of the number of years a person is expected to live. Factors affecting life expectancy are Country, Mental and Physical Illness, lifestyle, diet, health care services, financial condition, BMI, alcohol consumption, Diseases, etc.
Here in this Predicting Life Expectancy project, our motive is to find the life expectancy of a person after providing details such as the country he is living in is developed or is developing, BMI of the person, Disease history, Income, Population of that country, Expenditure, etc. So here I have used Machine learning and Artificial Intelligence to predict life expectancy. The data used in the training of the model was the data by WHO taken from Kaggle.
There were almost 22 columns stating different factors affecting Life expectancy and 2939 rows comprising data of different persons from different countries. Based on the results we got on Watson Studio some factors which were not affecting the Life expectancy much were removed and the scoring endpoint was obtained after running full code. This scoring endpoint is the URL that helps us to send payload data to a model or function development for analysis (such as to classify the data or to make predictions).
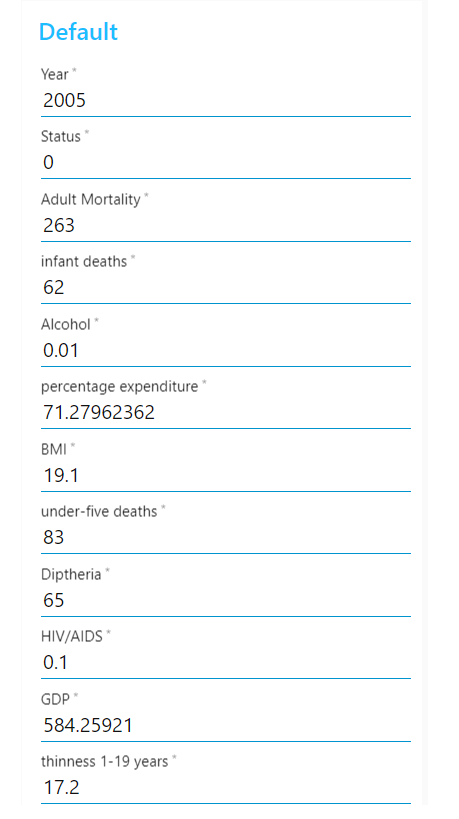
After obtaining the endpoint the next step is to work on Node-red which is the platform, we can use for developing our front-end page that will have a form asking you your details such as year of birth, adult mortality, infant deaths, BMI, etc. rest we’ll discuss in details later on.
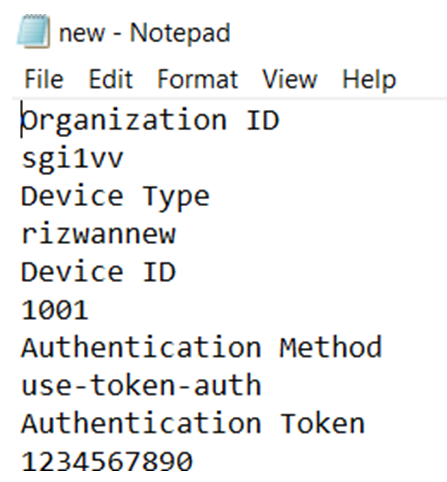
Requirements: IBM Cloud, GitHub, Slack, IBM Watson, Node-Red
1.2 Purpose:
The purpose of this project is to build a model that will predict the Life Expectancy of a person after giving the details of the BMI, Expenditure, Disease history, etc.
2. Literature Survey
2.1 Proposed Solution:
The project tries to create a model based on data provided by the World Health Organization (WHO) to evaluate the life expectancy for different countries in years. The data offers data on different person’s Physical health, Mental health, etc from the time frame 2000 to 2015. The data was taken from the website: https://www.kaggle.com/kumarajarshi/life-expectancy- who/data.
3. Theoretical Survey
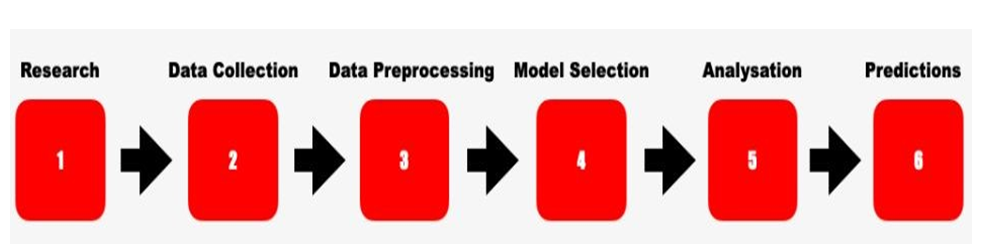
3.1 Block diagram
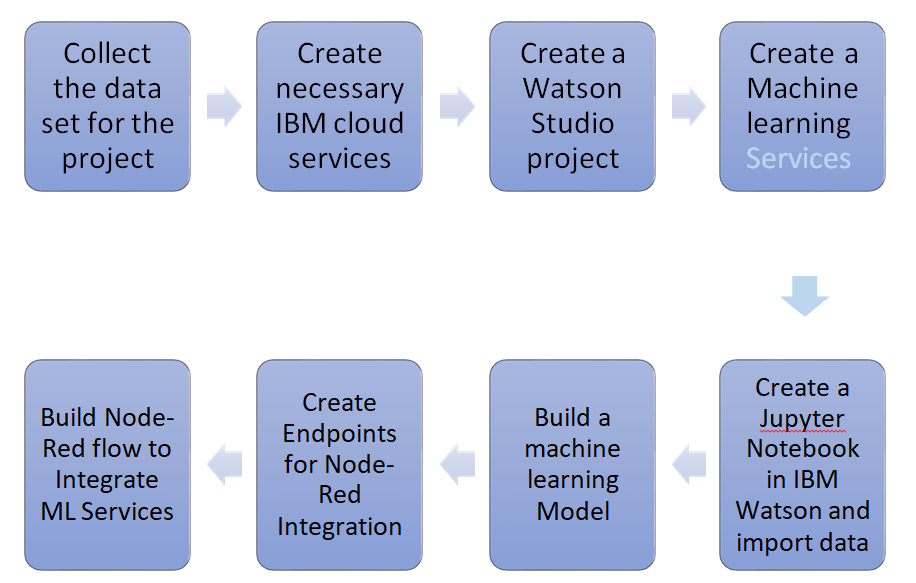
Block Diagram for Predicting Life Expectancy with Python
3.2 Hardware/Software Designing:
· GitHub
GitHub is the largest community of developers in the world with millions of people sharing their projects, and ideas for benefiting many people in a very unique way. Any person living in any corner of this world can access this platform for his/her benefit. They can share their problem, their ideas, and solution to some problems. In simple words, it is basically a platform in which anyone can come and share their problems and solutions. It is easy to manage. A team working on the same project can easily monitor the progress and can easily access their work anywhere.
· Slack
It is a messaging tool that is intended to contact your internal team easily. As it gives you a platform through which we can communicate to our team members easily under one roof. It is not as hectic as sending emails and reading them. It directly comes as a message to you from the group created having your team members. It is great if you are having a team of more than 2 members. Searching for messages becomes an easy, fast medium, searching old messages.
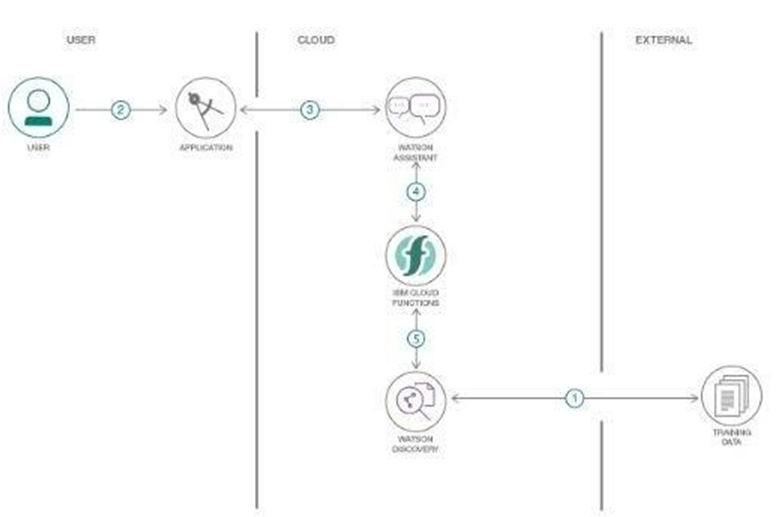
· IBM Cloud
It is the platform that enables us to use its various features such as Watson Studio which provides a platform where we can write our python code and observe our results in the form of heat maps, graphs, and tables. In this project, we used it and got our scoring endpoint. It is the URL that helps us to send payload data to a model or function development for analysis (such as to classify the data or to make predictions).
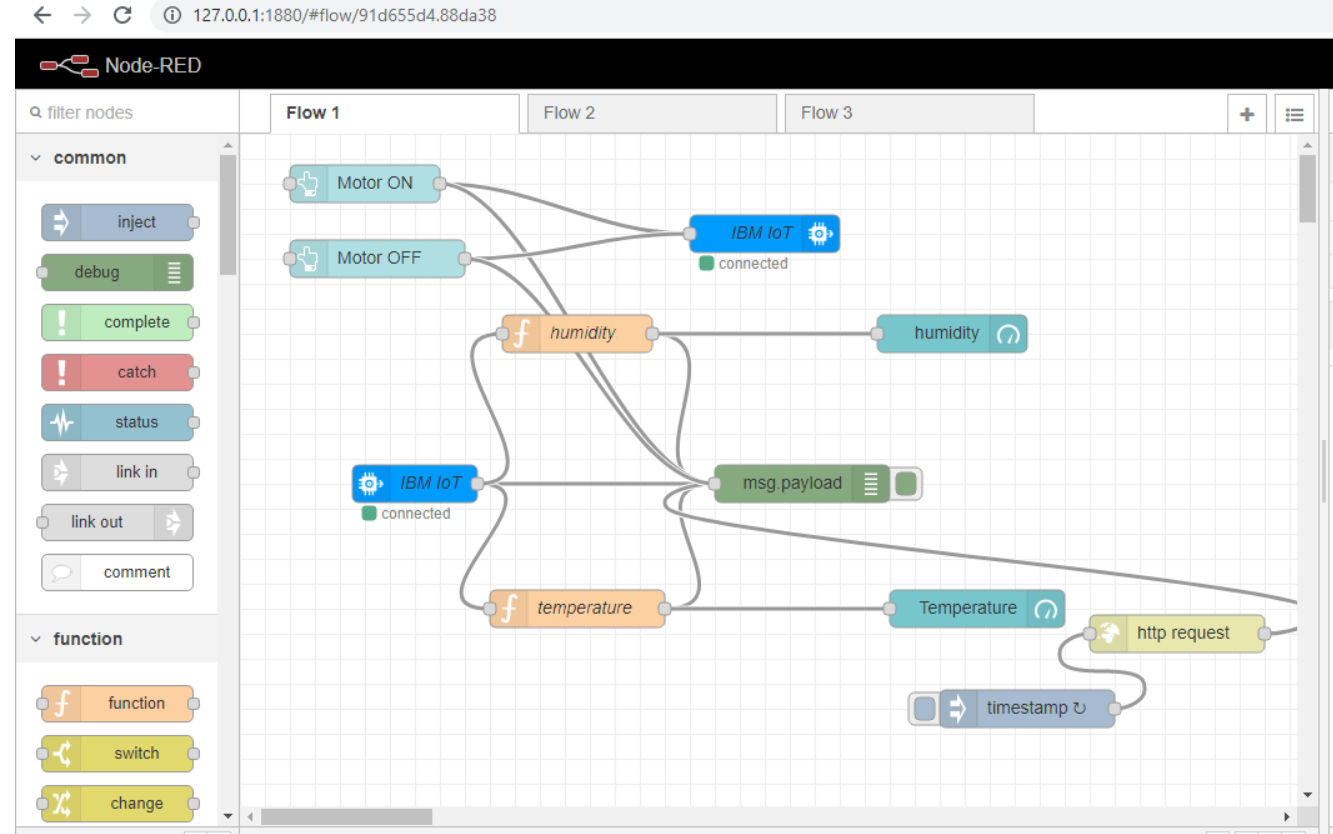
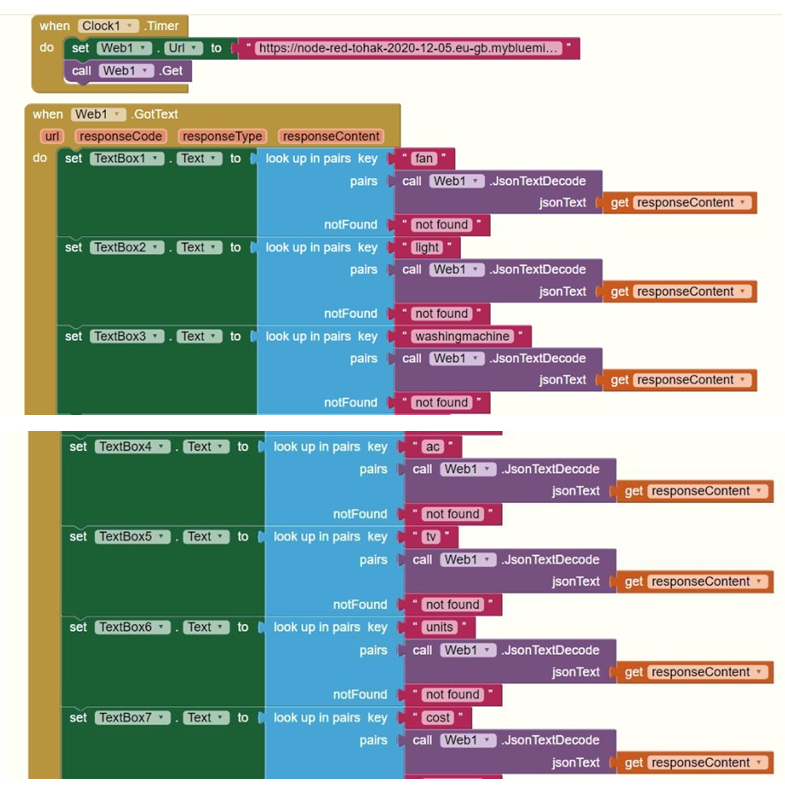
· Node-Red
Node-Red helps us to create a front-end window on which we can get the data from the user such as his Year, BMI, Alcohol intake, etc. and it will then connect to the code written on Watson Studio via the scoring endpoint created after running the python code.
4. Experimental Investigations
The graphs of various Factors affecting the prediction of life expectancy are shown in the figure given below:
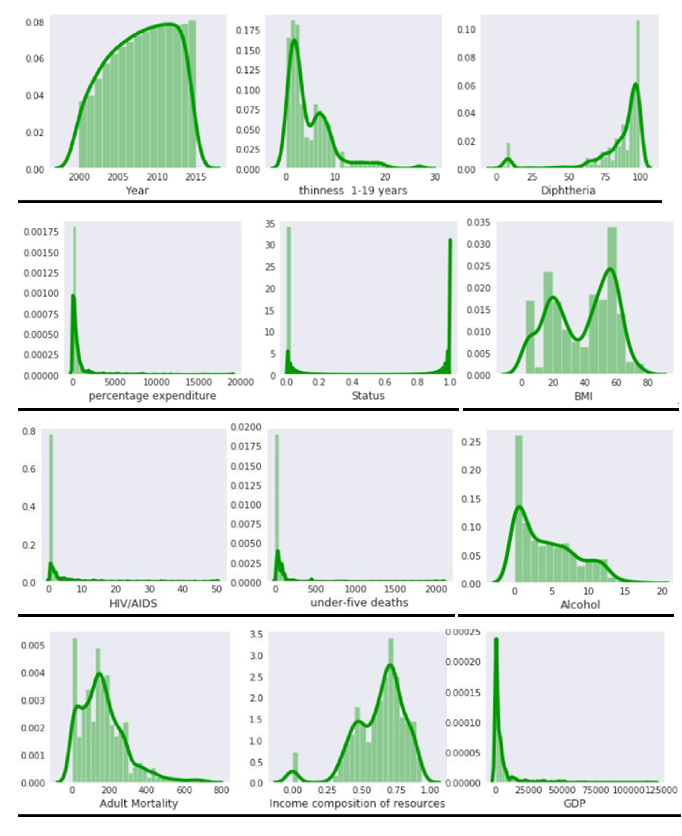
Curves of life expectancy v/s different factors
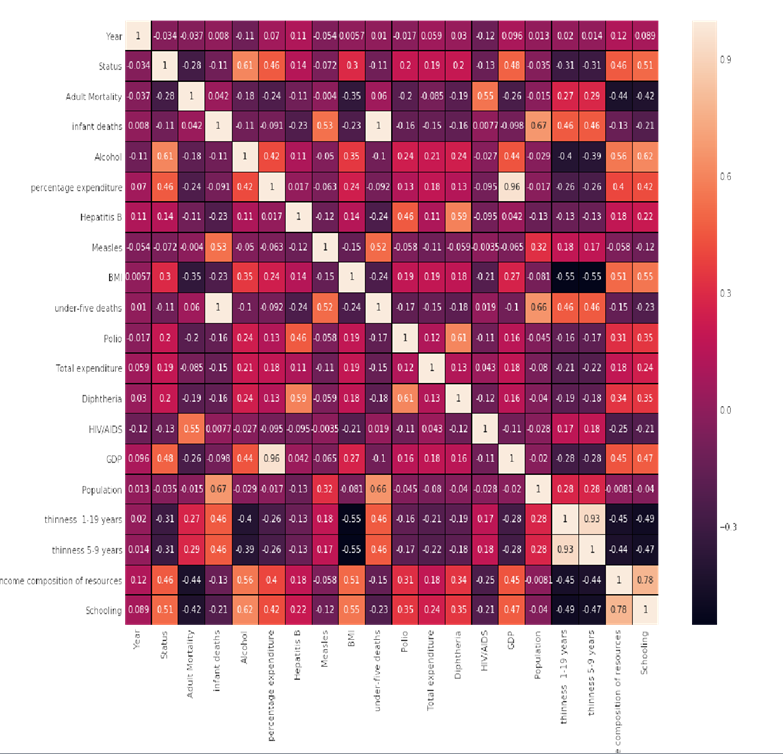
Heat map of different factors
Shown above is the heat map of the various factors affecting other various factors some of them have positive values some of them have negative but the thing we have to keep in mind is that we can’t neglect the factors having negative values because they will have the adverse effect which will affect the life expectancy. After some observations, I decided not to include 6 factors that are not affecting life expectancy much and will reduce the calculations and make our model less complex.
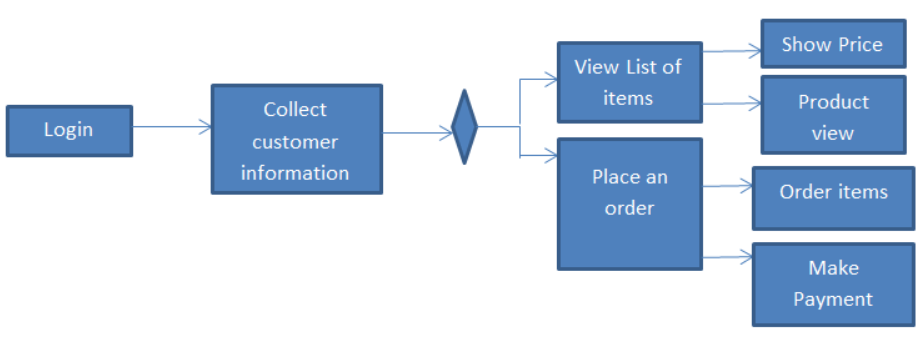
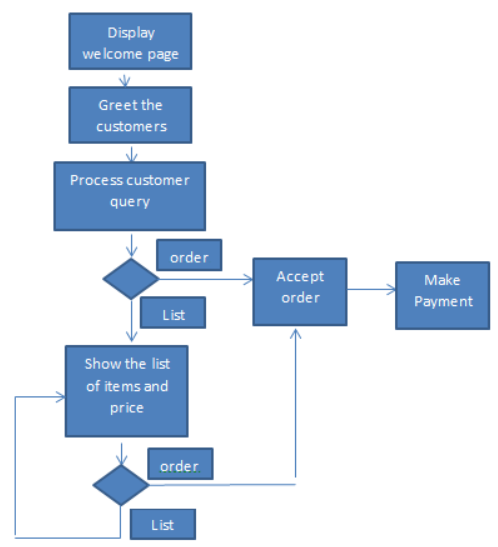
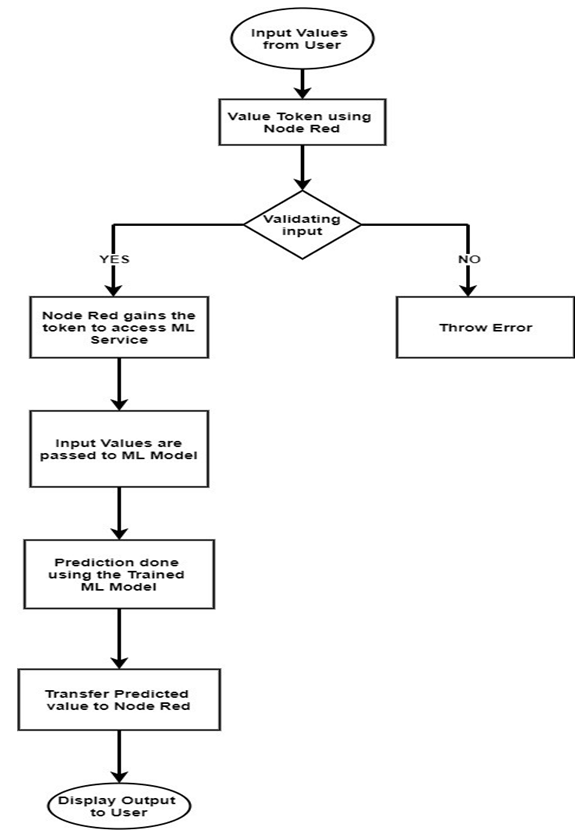
5. Flow Chart
- Result
After filling in all the necessary details asked in the UI form, we got the prediction of life expectancy. The accuracy of our model was 94.41%
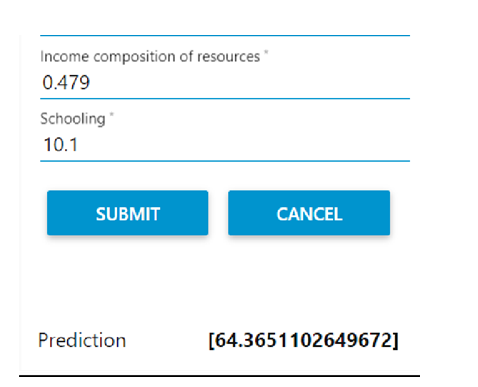
Screenshot of the prediction of life expectancy obtained
Advantages and Disadvantages
Advantages:
- Easily identifies trends and patterns
- Wide Applications
- Handling multi-dimensional and multi-variety data
- No human intervention is needed (automation)
- Continuous Improvement
Disadvantages:
- High error-susceptibility
- Needs a lot of time to implement
- Interpreting the results accurately
- Data set collection is a complex task
Applications
- The form created is easy to understand and is easy to fill by anyone.
- It can be used for monitoring health conditions in a particular country
- It can be used to get the data about the factor affecting Life expectancy the most in order to work in the direction of obtaining a high life expectancy
- It can be used to develop statistics for a country’s development process
Conclusions
This user interface enables any user to predict the life expectancy value of anyone on the basis of the details asked in the form.
Future Scope
- Increase model accuracy
- Gives suggestions on how to increase Life Expectancy
- Mental health data was missing from the WHO data set which also plays the important role in affecting life expectancy
- The scalability and flexibility of the application can be