MOS value
MOS value will be in a range from 1 to 5, where 1 indicates the bad quality, 2 indicates the poor quality, 3 indicates the fair value, 4 indicates the good quality and 5 indicates the excellent quality and in this context the actual MOS value recorded for the three scenarios is given in this section. The actual MOS values recorded are compared for all the three scenarios and presented in the below comparison graph as shown below
From this graph it is clear the MOS value recorded for the GSM quality speech is more when compared to the other scenarios. It is observed that a value of 3.6 is recorded for GSM quality and with this range it is clear that a good quality speech is incurred against the quality of service for voice application where the MOS value for low quality speech is only 2.5 which indicates that a fair quality is incurred with the voice and the MOS value recorded by IP telephony is around 3 and even in this case a fair quality speech is delivered and it can also observed that the MOS value for IP telephony and low quality speech are not constant and they were initially high and later at the end of the simulation their quality has dropped to a bad range.
This indicates that the quality of service requirements for IP telephony and low quality speech are depressed when the communication is proceeding and but with the case of GSM quality speech a constant MOS value is recorded and even this value indicates that a good quality of service requirements are imposed by GSM on the overall network performance. From this analysis it can be concluded that when the MOS value is more the overall quality of service is improved across the voice applications.
Packet delay variation
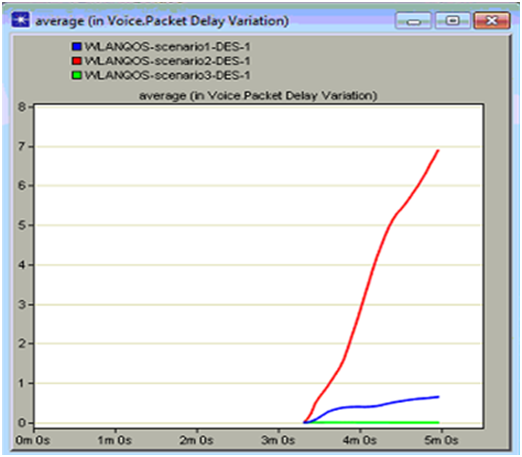
Packet delay variation indicates the actual delay caused due to voice application on the network and as three types of voice applications are used in this context the overall packet delay variation incurred by these three voice profiles is given in the below graph. If the packet delay variation is more then it indicates that the overall performance of the network is degraded a lot and due to this the quality of service is reduced and in this context the actual packet delay variation shown by these three applications is shown in the below comparison graph
From the above graph it is clear the overall packet delay variation is more with the IP telephony when compared to the other two scenarios. In general the IP telephony need more attention towards the CBR traffic and due to the CBR traffic the packet delay variation is increases a lot and thus the overall quality of service offerings is reduced a lot when compared to the other voice applications.
The packet delay variation occurred with the GSM quality speech is very less and is almost zero and this indicates the packets are transferred with an optimal rate without any delay across the network and thus the quality of service is increased a lot in this context. The packet delay variation occurred with the low quality speech is also less when compared to the IP telephony and this indicates that the overall noise across the speech is suppressed at this level and thus the packets are delivered at an optimal rate and thus the overall analysis it is clear that the quality of service can be increased with a low packet delay variation and again this can be achieved with the GSM quality voice application to improve the quality of service.

