Hydrology Civil Engineering Project – a study concerned with engineering application like design dam, our project given realistic case study (og catchment) in west bank. In our project we want to calculate the peak flow that produced from the excess rainfall at the area that we want to design the Dam.
In this project we want to determine the hydrograph for sub-catchment area 1 and 2 is 84 km² and 64 km² respectively.
Hydrology Civil Engineering Project Analysis:
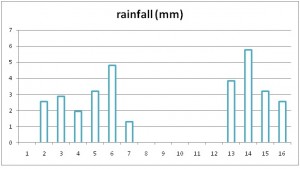
To estimate the volume, calculate each value for each hour of total rainfall by multiplying the percentage of rainfall by total amount of rainfall (32mm). Calculate the excess rainfall from the total rainfall by subtracting the losses (Φ-index which 2.5mm/hr) from each value for each hour of total rainfall which is not less than 2.5mm/hr.
Analysis is provided in project report.
- Estimate the volume of direct runoff and volume of infiltration (in million cubic meters) for 1 and 2 sub-catchments.
V= d*A
| depth under ⱷ-index |
| 23.2 |
| depth of excess rainfall |
| 8.8 |
| Area(KM² ) | vol. of infil.m³ | vol. of dir. runoff m³ | vol. of infil. Mm³ | vol. of dir.runoffMm³ | |
| 1 | 84 | 1948800 | 739200 | 1.9488 | 0.7392 |
| 2 | 64 | 1484800 | 563200 | 1.4848 | 0.5632 |
- We calculate the hydrograph then estimate the volume of direct runoff from hydrograph (Compare your results with those of part 1.) Will be discussed in discussion and conclusion part(1).
We have 1 h.u.H , and the storm divide by 1 hr so, we don’t need convert between D h.u.H.
for sub-catchment 1 and 2 as follow:
Analysis is provided in project report.
- We use the SCS method to derive a 1hr-UH using the SCS method (Compare your results with the given UHs.) Will be discussed in discussion and conclusion(2). By using SCS Dimensionless method unit hydrograph, this method is analyzed andillustrated in the next tables.
Analysis is provided in project report.
- we calculate the hydrograph after 3km because we want to design the dam as follow, first we calculate the constant for the equation
| k= | 2 |
| x = | 0.2 |
| t | 1 |
| Kx= | 0.4 |
| k-kx+.5t | 2.1 |
| C0 | 0.05 |
| C1 | 0.43 |
| C2 | 0.52 |
| 1 |
Discussion and Conclusion:
(1) From part 1, the volume of direct runoff and volume of infiltration (in million cubic meters) for 1 and 2 sub-catchments.
| vol. of dir.runoffMm³ | |
| 1 | 0.7392 |
| 2 | 0.5632 |
From part 3, the volume of direct runoff from hydrograph (in million cubic meters) for 1 and 2 sub-catchments.
| vol. of dir.runoffMm³ | |
| 1 | 0.749232 |
| 2 | 0.562003 |
By comparing between it, approximate equal but there very small error , this inequality is because the depth of the given 1-mm UH for each catchment doesn’t equal 1-mm.
(2) Compare between derive a 1hr-UH using the SCS method and results with the given UHs.
From 1hr-UH using the SCS method:
atchment 1:
| Tp= | 2.9 | hr |
| Tb= | 7.743 | hr |
| Qp= | 60.24828 | m³/s |
From given 1hr-UH
As we shown 1hr-UH
The peak of the given 1-hr UH and the peak of the estimated 1-hr UH by SCS method are the same for each catchment. But the time base different from those in the given 1-hr UH.
The time base of 1 catchment for the given 1-hr UH is 35 hrs, but for the estimated 1-hr UH by SCS method is 14.5 hrs.
The peak of the given 1-hr UH and the peak of the estimated 1-hr UH by SCS method are the same for each catchment. But the time base different from those in the given 1-hr UH.
The time base of 2 catchment for the given 1-hr UH is 31 hrs, but for the estimated 1-hr UH by SCS method is 14.5 hrs.
Also, note that the two time base for the estimated 1-hr UHs by SCS method for the two catchments are the same and equal 10 hrs.


I like this site