User manual
Detailed simulation steps followed in this frequency based approach to intrusion detection project is given with the required screenshots is given in this section
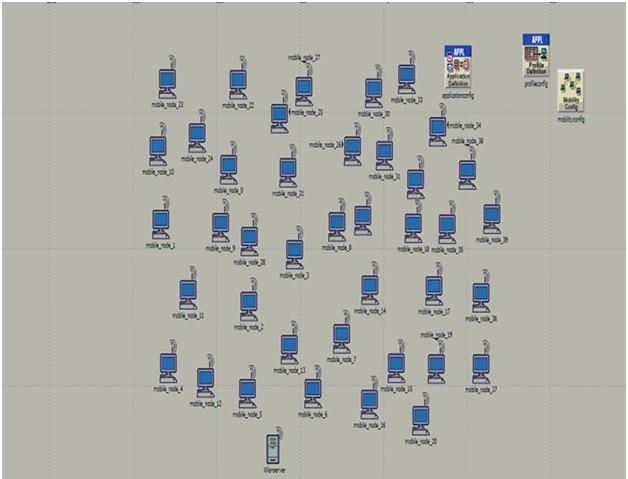
Above screen shows the basic network with 30 mobile nodes, application configuration, profile configuration and the wireless LAN server. All these nodes are dragged from the object palette and this palette is shown in the simulation procedure chapter.
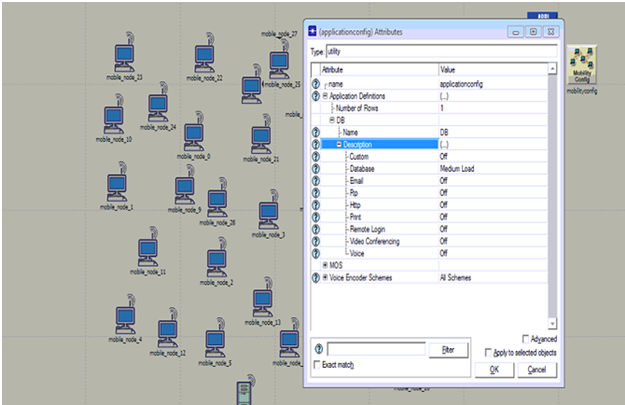
Above screen shows the application configuration and from this it is clear that DB is used as the application and it is set by medium load across the database option.
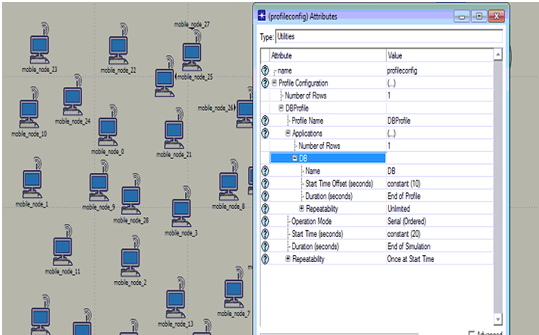
Procedure to setup the profile configuration is shown in the above screen. From this it is clear that DB application is used to set the profile and the start time and duration are set in the profile settings as shown in the above screen
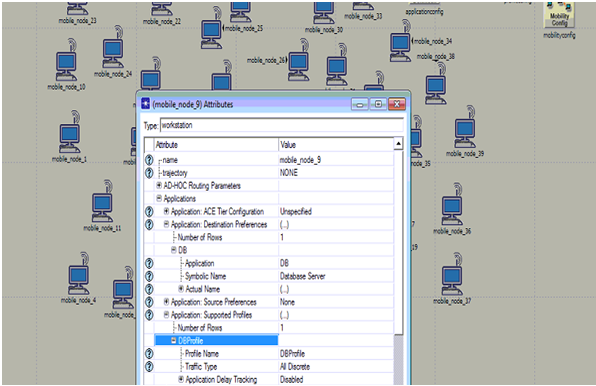
Application settings to the nodes are shown in the above screen. From this screen it is clear that application destination preferences and the application supported profiles are set against the database application created.
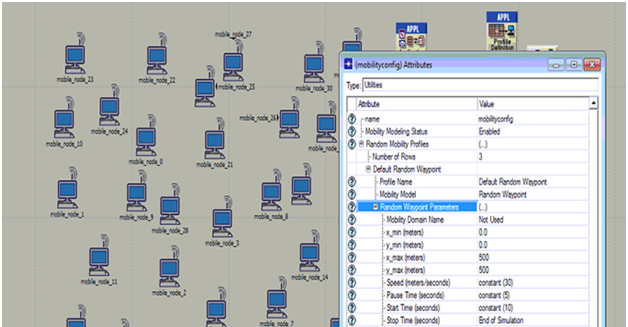
Mobility configuration is set and the process is shown in the above screen. From this screen it is clear that default random waypoint is used as the required mobility model and few aspects like speed, pause time, start time and stop time are set as shown in the above screen.
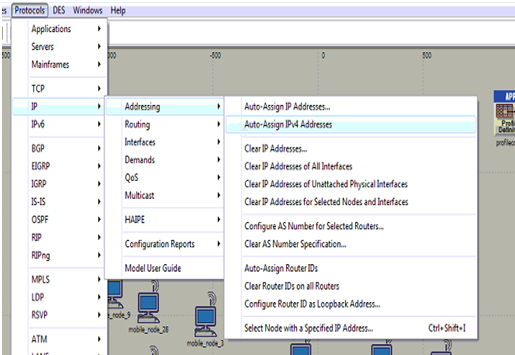
Assigning the IP addresses to all the mobile nodes is shown in the above screen and it is clear from the above screen that IPV4 address are added to all the nodes and the wireless LAN server.
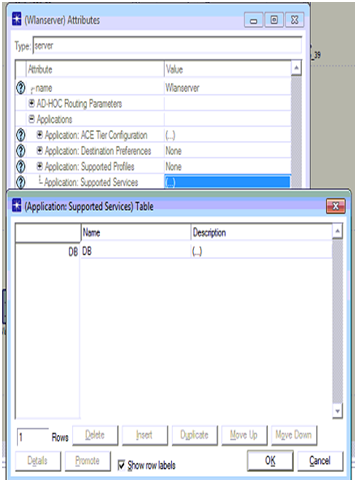
Database is set as the required application to be supported across the server and the corresponding screen is as shown below
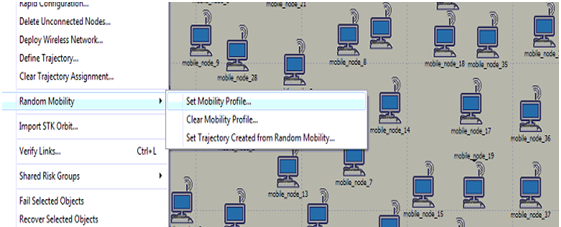
Procedure to set the mobility to all the mobile nodes against the mobile configuration is shown in the above screen and by this the default random waypoint is set to all the nodes across the network.
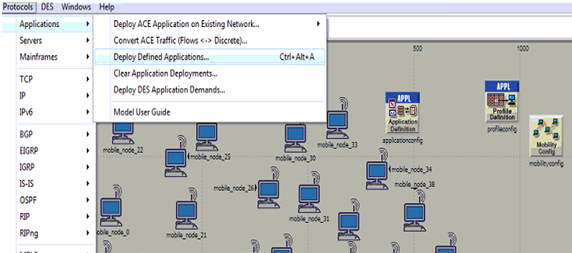
Process to deploy the application is shown in the above screen and this option is available from the protocols menu and applications sub menu and the corresponding screen is as shown below
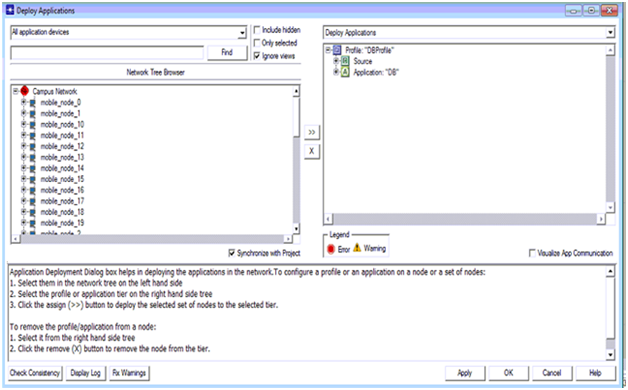
Once the deploy option is selected the corresponding deployment screen is as shown above. From this screen it is clear that all the mobile nodes are shown on the left side and the corresponding source and destination are defined at the right side. Arrow mark available on middle of the window can be used to deploy the nodes and server to the source and destination respectively.
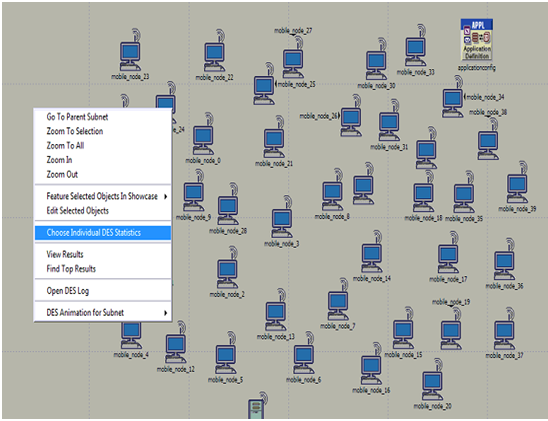
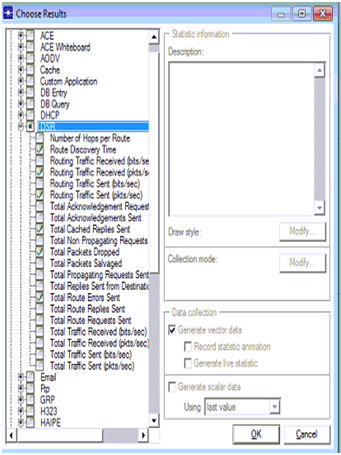
Once the applications are deployed the next step is to choose the individual DES statistics and the corresponding screen is as shown above. DES statistics are used to set the performance metrics and the corresponding screen is as shown below
DSR parameters are set across the performance evaluation process and the actual parameters chosen from the global statistics are shown in the above screen
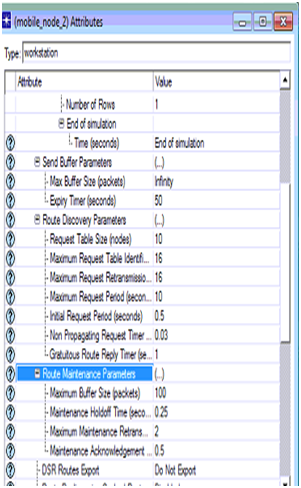
The actual attributes edited for the DSR routing protocol in the second scenario are shown in the above screen and thus the node 2 acts as the intruder node.
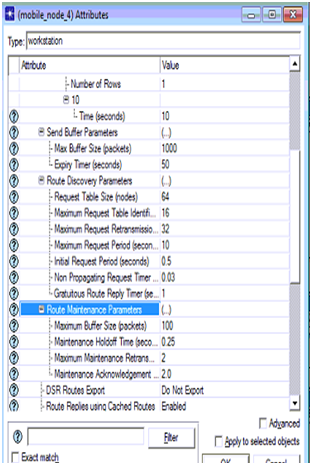
DSR parameters set for the node 4 is shown in the above screen
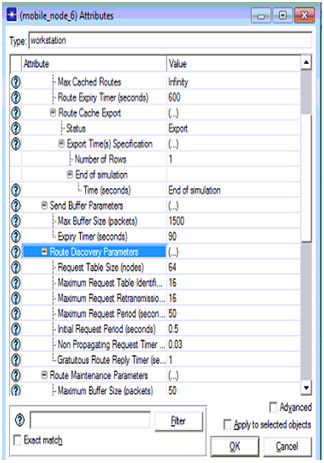
DSR parameters set for the node 6 in the third scenario are shown in the above screen and thus there are three attack nodes across the network.

