In This Post we are going to explain how E2M project works with DFD’s and how the table connections given between employees and management. Here we have three levels of Diagrams and each one explains in-depth behavior of the application.
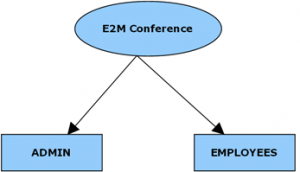
The below top level data flow diagram explains about how the E2M project given relationship with administrator and staff employee.
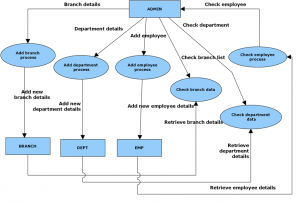
The below Level 1 DFD explains about how the connections are given between admin to branch, department and employee and many more sub connection given.
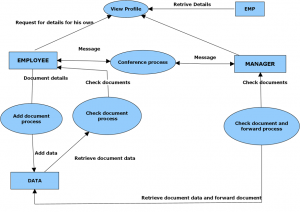
The below level 2 DFD explains inner behaviour of the tool like profile viewing, conference processing, send message and documents.
Download E2M Conference Final Year Project DFD data Flow diagrams.


