Temperature and Air Quality Monitoring System Project for Pet lovers

Introduction:

In this modern world, there are many pet lovers who would like to carry their pets to places wherever they go. It’s the responsibility of the same person to ensure the safety of their pets. There are some public places where they can’t take their pets. For example, if a person visits a shopping mall he can’t carry his pet into the shopping mall. Hence, he/she has to park his car in the parking lot, leave his pet inside the car, slide down the window a little bit for air circulation and continue his shopping.

For suppose he/she forgot to slide down the window and left for shopping then the pet gets suffocated due to lack of air circulation and a rise in temperature. Even though he/she slides down the window and leaves for shopping there is a possibility that one of the many people inside the parking lot may smoke a cigarette. The smoke released may enter the car and damage the air quality which in turn may have effects on pets.

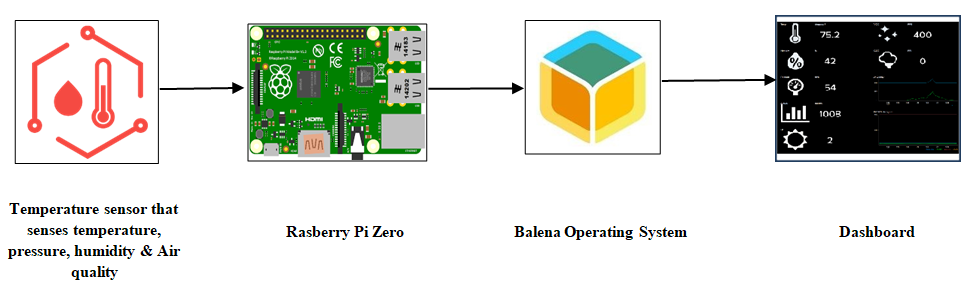
This is where our project finds its scope. We are developing a “Temperature and Air quality monitoring system for Pet lovers” in which we are monitoring the temperature levels, humidity, pressure, and air quality of the air inside our automobile and present them in an attractive dashboard so that the pet owner can monitor the atmospheric conditions inside his automobile through all of his gadgets having internet connection.

High-level architecture of the project:

Hardware Requirements:

  • Raspberry Pi Zero
  • 32 GB or larger Micro–SD Card
  • Power Supply and cable
  • BME680 Sensor
  • Connecting cables

Software Requirements:

  • Balena Cloud to create dashboards using sensor data
  • Balena Etcher to flash our SD card
  • Balena CLI for command line interface
  • Balena Sense code for installing the services

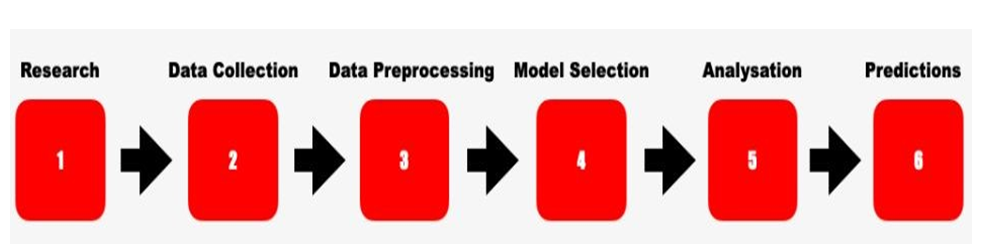
Project Implementation:

Step-1:

  • The first step of our implementation is to flash the operating system is to flash balena operating system into our Raspberry pi zero board.
  • For this initially, we have to create a balena cloud
  • Once we signed up and login into our balena cloud account then we have to create an application as shown below with our Wifi SSID and password and then we have to download Balena operating system image
  • Once we download the operating system image file then we will insert our SD card into card reader and connect the card reader to our
  • Then we will flash the OS image file into an SD card by means of balena Etcher as shown
  • By end of this system, our SD card should be ready with the flashed operating system for insertion into our Raspberry Pi zero board.

Step-2:

  • The main aim of this step is to complete the hardware
  • Please find the pin configuration of the Raspberry Pi Zero
  • Please find the pin configuration of the BME680 sensor
  • The connections are listed below:

Pin1 of Raspberry Pi zero——- CC pin of BME680

Pin3 of Raspberry Pi zero—– SDA pin of BME680

Pin 5 of Raspberry Pi zero—– SCL pin of BME680

Pin 9 of Raspberry Pi zero—– GND pin of BME680

  • Once we complete the connections to the BME680 sensor then we have to insert the flashed SD card into the SD card slot of our Raspberry Pi Zero
  • Please find the Raspberry Pi zero board after the connections are done as below:

Step-3:

  • Once we completed step 2 then we have to power up our Raspberry Pi zero board and then we have to open balena
  • If everything goes right our device must automatically be listed in balena cloud as shown
  • Then we have to install Balena command line interface for pushing the services
  • Then we have to push balena sense code into our board by using push
  • Please find the balena CLI below:
  • Once the push is successful then automatically the services get installed as shown below:

Step-4:

  • When the above three steps are successful then our cloud starts pulling the data from the sensor
  • To see the readings in dashboards we need to enable the public device URL and we can copy the URL we can access the dashboards on any device on which a web browser is installed across any geographic location.
  • Please find the screenshot of the dashboards below:
  • Then for testing purposes, I started breathing on the sensor. As we all know human breath contains CO2 and it is warm we can see on the dashboards as Indoor Air Quality showing Unhealthy and temperature is also raised as
  • After I have stopped breathing on the sensor within some time the IAQ returned to Good and also we can see the temperature started dropping as
  • As I have mentioned earlier every individual having a public device URL can monitor the dashboards from any electronic device which has a web browser installed in it. Please find the dashboards opened from the mobile phone
  • Hence the device is placed in a car with wifi module connected to it our device starts sending the data to the cloud. Hence even though pet owners leave their pets in cars and left for shopping can monitor the temperature and air quality and can make sure their pet is safe.

Corona Virus Prediction and Analysis Machine Learning Project

1.  Introduction 

Background 

Currently, there are many people, who are being affected by CoronaVirus. It started in China and now it is spreading all over the world. Till now, there is no medicine for this virus, and it’s killing millions of millions of people. So, it is a big question among all of us of how many people are going to be affected.

Problem Statement 

Currently, there is no application that can predict the spread of CoronaVirus for the future 30 days. So, with this project, we would like to create awareness among the people, by showing them how the corona rises for the future 30 days so that they can take some preventive measures by staying indoors.

Project Goal 

The main objective of this Corona Virus Prediction project is :

  • Future prediction of the increase/decrease in the number of active Coronavirus Cases for the next 30 days – for the whole world as well as for the United States of America. We have chosen the USA among all the counties as it is the highly affected country due to corona.
  • Future prediction of the increase/decrease in the number of deaths due to Coronavirus for the next 30 days.
  • Future prediction of the increase/decrease in the number of recovered cases due to Coronavirus for the next 30 days.

2.  Literature Review

 There is an outbreak of Corona in early December. This is caused due to severe acute respiratory syndrome coronavirus 2, which is basically the family of SARS virus. Many governments all over the world are issuing their own preventive measures to control the spread of coronavirus. So, we have conducted a literature review regarding this virus, based on the information that is publicly available.

Background of Literature Review:

China alerted WHO on 31st December 2019 that many people are reported to be suffering from Pneumonia, in Wuhan City. They reported that it started on Dec 8th, 2019, and there were an increasing number of patients who are working or living around the Huanan Seafood Wholesale Market.

When we started working on this project at the start of February, the Coronavirus was majorly prevalent in China. Initially, at the time of our project proposal, the mortality rate in China among all the confirmed cases is around 1.2% as of February 2020. And the mortality rate in all other countries, other than china was around only 0.2%. Among all the patients, who were admitted to the hospitals, the mortality rate, was around 11%. COVID-19 is increasing with great speed, and now there is a relatively very high mortality rate

A Way to Further Research :

So, we have performed this literature review, to analyze the spread of coronavirus. After analyzing how increasingly it’s spreading all over the world, we thought of performing our own prediction regarding this virus, so as to make people aware of its spread, and with this, they can take their own preventive measures, so that they do not fall prey to this dangerous virus.

We had very little amount of data when we started this project. It is a very trending topic all over the world. And millions of millions of people are losing their lives due to this virus. So, we are very curious to analyze this pandemic and so we have taken up this project.

We have found many datasets to collect data regarding the corona cases. Some of them include Kaggle, John Hoppkins, etc. So, we thought of choosing the dataset from John Hoppkins, as it’s updating the dataset on a daily basis. So, we collected the data and performed our own future predictions.

3. Methodology 

Approach

 So, basically, we have followed the below approach to kick-start our Corona Virus Prediction project:

  1. Firstly, we have started with research on choosing the datasets. On performing research on various datasets, we have finalized with John Hoppkins data set, as it gives us the live data on coronavirus.
  2. Secondly, we have collected the data and performed our preprocessing operation, so as to make our data ready for future predictions.
  3. Next, coming to choosing the machine learning algorithm. We have chosen appropriate machine learning(we will discuss below regarding this).
  4. Finally, we have performed our predictions to analyze the active cases, deaths, and recoveries for the next 30 days, based on the data available from the datasets and the chosen machine learning algorithm.

Figure: Approach

4.  Implications 

Benefits of the Project: 

  • This Corona Virus Prediction project helps in the prediction of coronavirus cases for the next 30 days, all over the world.
  • With this, we can also predict the increase in corona cases in the world.
  • By this, we can know how fast the coronavirus is spreading all over the world.
  • We can create awareness among people.
  • We can also create awareness in government so that they can take preventive measures to stop the spread of corona.

Lessons Learned:

Initially, I had no idea of a Machine learning algorithm. I started learning about machines from scratch. I bought some Udemy tutorials and through that, I learned everything step by step. At the start of the project, I am not even aware of what machine learning algorithm to use.

It was really an exciting experience doing this project. I am inspired to take up a Machine Learning Course for my next semester to learn deeply about Machine Learning Algorithms.

I tried my level best and contributed my 100% to this project.

Now, I came to know about machine learning, different types of machine learning Algorithms, and the differences between classification and regression algorithms -when to use what, creating test and train sets, building up the model, choosing the appropriate parameters, and performing future predictions. In the future, I would also love to take up a project related to Classification Algorithms.

5.  Conclusion 

  • Finally, to conclude, we have performed prediction using SVR and Polynomial Regression Algorithm.
  • SVR predictions are mainly for predicting the world case scenario, which includes confirmed, death, and recovered cases.
  • Polynomial Regression is used for the prediction of US Cases.
  • Based on the results, we believe that our predictions were almost accurate, with some little differences from the actual values.
  • This project can be further scalable, to include the predictions for various individual

6.  Appendix 

  • We have used Google Collab for our project. As we are two members of the team, we have chosen this, because it enables us to simultaneously work on the project from different
  • No Installation is Required.
  • We just need to have a google account. And we can easily create a Google Collaboratory file in our google drive, just like Google docs.
  • We will provide both .py files as well as .ipynb files along with this report, so as to run on google collab.
  • .ipynb can be uploaded to google collab directly and the results of the projects can be easily checked.

Smart Agriculture System Project on IBM IOT platform using NodeRed framework

Project Scope

We need to follow these steps to complete our Smart Agriculture System Project:

  • Project Planning and Kickoff
  • Explore the IBM Cloud Platform
  • Connect the IoT Simulator To the Watson IOT Platform
  • Configure the Node-red to Get the Data From the IBM IoT Platform And Open Weather API
  • Building A Web App
  • Configure Your Device to Receive The Data From The Web Application And Control Your Motors

Our Project’s main aim is to help farmers to control their motors from home. He/ She can On and Off his motor by using his mobile phone.
By using Weather API he can know the weather conditions like temperature, humidity, and soil moisture.

Project Background:

  • This Smart Agriculture System Project mainly aims to help the farmers to ease their work.
  • Farmers can get real-time weather conditions by using smart agriculture.
  • Instead of physical devices we create devices in the IBM IoT platform and use them in our project.
  • We connect our device to the IBM node in the NodeRed framework.
  • We need to create a Weather API account to configure the weather API Platform.
  • We then Configure our Node-red to get the weather forecasting data using HTTP requests.

Project Schedule:

  • Project Planning and Kickoff
  • Explore IBM Cloud Platform
  • Connect The IoT Simulator To the Watson IOT Platform
  • Configure The Node-red To Get The Data From IBM IOT Platform And Open Weather API
  • Building A Web App
  • Configure Your Device To Receive The Data From The Web Application And Control Your Motors

Project Requirements:

  • IBM Cloud Account and IBM Watson IOT Platform to create device and sensor
  • Python IDE
  • Node-Red
  • Open weather API Platform

Functional Requirements:

  • Measure Temperature.
  • Gauge Temperature.
  • Gauge Humidity.
  • Gauge Pressure.
  • Weather API.
  • Display the sensor readings using the Watson IOT sensor.
  • Respond to sensor readings and send alerts to the user.

Technical Requirements:

IoT Simulator

Software Requirements:

  • Python
  • Node-Red
  • IBM Watson IOT Platform
  • Open Weather API

Project Deliverables:

A Smart Agriculture System web App for farmers where he can:

• Monitor temperature, humidity, and Soil moisture along with weather forecasting details.
• Control motor for watering the crop through the web app from where he was.

THEORETICAL ANALYSIS

  • Required Software Installation
  • Node-Red

Installation:

  • First, install the Node
  • open command prompt
  • Type ->npm install node-red

To Run the application:

  • open command prompt
  • And then type “node-red”
  • Now open http://localhost:1880/ in the browser

Installation of IBM IOT nodes and Dashboard nodes for Node-Red

  • In order to connect to the IBM Watson IOT platform and create the web UI, these nodes are required
  1. IBM IoT Node
  2. Dash Board Node

IBM Watson IOT Platform

  • Steps To Configure:
  • Create an account in the IBM cloud using your email ID
  • Create IBM Watson Platform in services in your IBM cloud account
  • Launch the IBM Watson lot Platform
  • Create a new device
  • Give credentials like device type, device ID, Token
  • Create API key and store API key and token elsewhere

Python IDE

  • Install python 3 Compiler
  • I Installed PyCharm Community Edition 2020

IoT Simulator

 In our project in the place of sensors, we are going to use a lot sensor simulator which gives random readings to the connected

OpenWeather API

Building Project

Connecting IoT Simulator to IBM Watson IOT Platform

  • Open link Provided in section 4
  • Give the credentials of your device in IBM Watson IoT
  • Click on Connect
  • My credentials given to the simulator are:
  • Organization ID:ka1gns
  • Device Type:nodemcu
  • Device ID:1234five6789
  • Authentication Method:use-token-auth
  • Authentication Token:*********
  • You, Will, receive the simulator data in the cloud
  • You can see the received data in Recent events
  • Data is received in this format (JSON)
  • You can see the received data in cards by creating cards on Boards Tab

4.2    Configuration of Node-Red to collect IBM Cloud Data

  • The Node-Red IBM IoT App is added in Node-Red Work The appropriate device credentials obtained earlier are entered into the node to connect and fetch the device to Node-Red
  • Once it is connected Node-Red receives data from the device
  • Display the data using debug node for

Configuration of Node-Red to collect data from Open weather API

  • The Node-Red also receives data from the OpenWeather API by HTTP GET request. An inject trigger is added to perform HTTP requests for every certain
  • The data we receive from OpenWeather after the request is in JSON format

Configuration of Node-Red to send commands to IBM Cloud

  • By using IBM IoT out Node I used to send data from Node-Red to IBM Watson So, after adding it to flow we need to configure it with the credentials of our Watson device.

Adjusting UserInterface

  • By connecting all the flows shown above
  • We can display our UI by clicking on the dashboard tab in Node-red
  • On the above page, we can display the sensor data and motor
  • On this page, we open weather API data is displayed