
Title : Real-Time Map-Based Pollution Monitoring And Data Management System
Introduction: For years, pollution has been a major issue faced by mankind and it is increasing by the day. The recent pollution disasters that happened in major cities across the globe have taught us one thing and that is, that it is important to keep an eye on the pollution that is increasing day by day. Many government and global organizations have started to work on it and almost a decade has passed since these programs have been functioning. But, the major issue with these organizations is that they are focused on beating pollution on every front whether it is air pollution or water pollution.
These organizations are more focused on amending laws for pollution control and the monitoring process boils down to analyzing air quality and then making changes in the environmental laws. Also, the issue is that these bodies are controlled by the central or federal government. But, pollution is no longer an issue that can be tackled gradually and conventionally. It needs immediate attention and effective monitoring is required so that the authorities can take necessary measures to solve the pollution problems.
The pollution problem is more persistent in urban metropolitans and metros. But, municipal corporations have very little control over the situation because of a lack of data to act upon. Recent developments in the smart city sector are also encouraging cities to develop monitoring systems. The city of Ahmedabad, Gujarat has implemented digital signboards that show the real-time value of major air pollutants and overall air quality. This data is displayed to the people driving on the road so that they can take necessary precautions to avoid or minimize the health risks due to pollution. But, this kind of Pollution Monitoring project requires a huge amount of funds and is also not feasible everywhere.
So we are building a minimalistic model to tackle the issue of monitoring pollution. Our main goal is to provide real-time data visualization and also provide a database that will store all the data and provide readings of various pollutants. The data will be visualized through the means of a map hence it would be easy to pinpoint the exact location when any kind of action is needed. We will also build a device to capture data and then feed it into a web application that can be used to monitor and visualize the data.
The main aim of this Real-Time Map-Based Pollution Monitoring project is to provide a centralized repository of sensor data and also to create an effective and centralized monitoring system. The low cost and feasibility of the project make it easy to use for both smart cities as well as small towns. Furthermore, this kind of monitoring system will allow for the development of effective countermeasures and control strategies for keeping the pollution problem in check.
Process Flow:
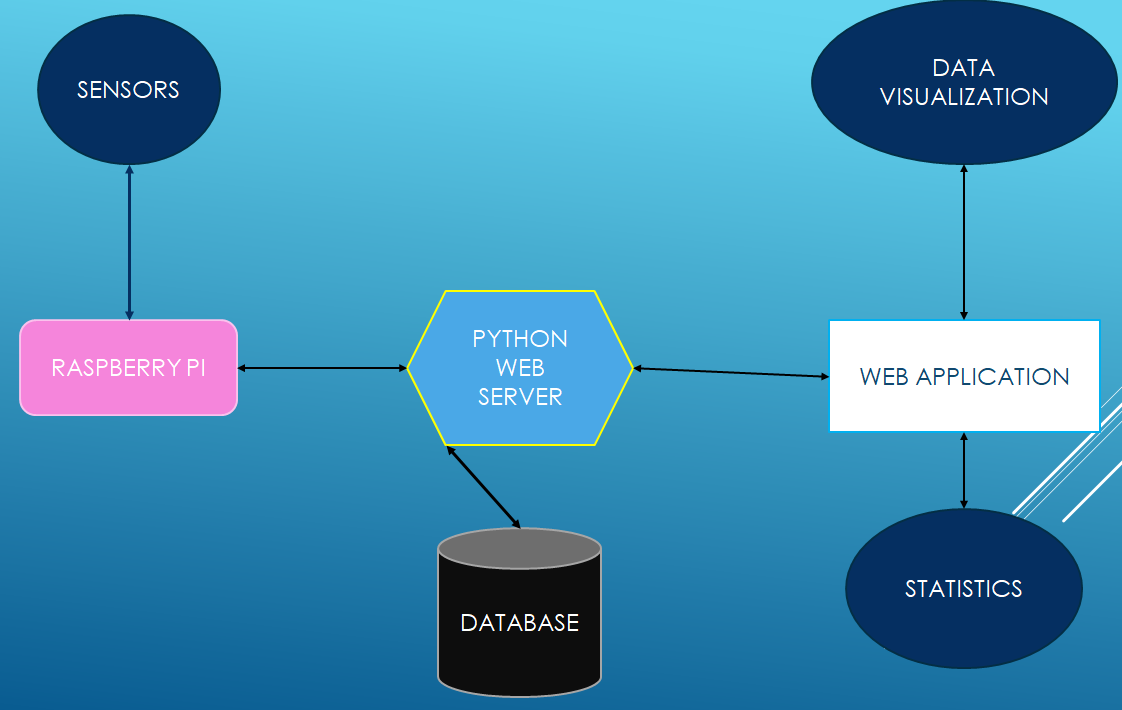
Methodology
Methodology
This Real-Time Map-Based Pollution Monitoring project is aimed at local authorities like the municipal corporation rather than the central government so that immediate action can be taken by them to control the pollution problem.
This Pollution Monitoring project can be briefly divided into three main parts:-
- Data Collection.
- Data Monitoring.
- Data Storage.
1. Data Collection:
Data collection is an important part of this Pollution Monitoring System project. Any kind of monitoring system is functional only because of the data that has been provided to it.
Data collection will be consisting of reading data from sensors. Now, from the research conducted, we have been able to deduce the major kind of data that we need. Looking at the urban pollutants we have observed that the most prominent pollutant is the Particulate Matter (PM) and Suspended Particulate Matter (SPM).
Hence we have decided to use a DSM501A Particulate Matter and Suspended Particulate Matter Sensor for detecting PM(2.5) or Particulate Matter, which is one of the major pollutants. Also, it leads to various lung and carcinogenic diseases and skin problems.
Particulate Matter concentrations have raised dramatically in the past decades to increase the number of automobiles on urban roads. Hence we have decided that monitoring PM/SPM (Particulate Matter and Suspended Particulate Matter) is going to be one of the main agendas of our monitoring system.
Another major pollutant that has been identified is Carbon Monoxide (CO). Now, CO is not just a single pollutant but, it is also responsible for creating another harmful pollutant i.e Ozone (O3). Ozone is important for blocking UVs from the sun but, at the ground level, the Ozone is a dangerous gas. Carbon Monoxide is specifically dangerous as it affects the hemoglobin if the concentrations exceed 35 ppm (parts-per-million).
From the research we have done, it has been clear that CO is present in spatial quantities but, that means that we need to effectively monitor it to keep its concentrations at safe levels. We will be using an MQ-7 sensor for measuring Carbon Monoxide.
Studies have pointed out that SO2 and NO2 are also major air pollutants and contribute to the degradation of overall air quality. Also, several hydro-carbon compounds are pollutants although not major, affecting the air quality a lot. Hence we have decided to use an MQ-135 sensor to monitor SO2 and NO2 levels as well as the overall air quality.
The sensors will be interfaced on a Raspberry Pi and their data will record using the GPIO library (Python). The data from these sensors will then be directed to the web server and the storage.
2. Data Monitoring:
Data Monitoring is the key component of the system. To monitor the data we have decided to use Google Maps so that the position of our Raspberry Pi Module can be pinpointed and then by using color-coding we can determine the levels of pollution in the vicinity of our Raspberry Pi Module.
All of this will be achieved by creating a web server in Python using the Flask framework and the main desktop app will be a web application written in HTML, CSS, Bootstrap, and JavaScript. The desktop app will have three options
- Map-Based Monitoring
- Individual Pollutant Monitoring
- Statistics
3. Data Storage:
Data Storage is necessary to reference past data and develop statistics from them. The data will be stored locally on the file system and can be downloaded in the form of excel sheets.
Timeline
|
Serial Number |
Tasks |
Duration |
|
1. |
Synopsis and Presentation Submission |
15 days |
|
2. |
Component Purchasing and Testing |
15 Days |
|
3. |
Interfacing sensors and writing server script |
15 days |
|
4. |
Writing Front-End Application |
15 days |
|
5. |
Integrating Front-End and Back-End services |
15 days |
Components
- Raspberry Pi model B
- SD card and adapter
- MQ-7 sensor
- MQ-135
- DSM501A