Analysing Region Wise E-Commerce Data Using IBM Cognos Dashboard

Analysing E-Commerce Data Project Objectives 

  • Know fundamental concepts and can work on IBM Cognos Analytics.
  • Gain a broad understanding of plotting different graphs.
  • Able to create meaningful dashboards 

Project Flow

  • Users create multiple analysis graphs/charts.
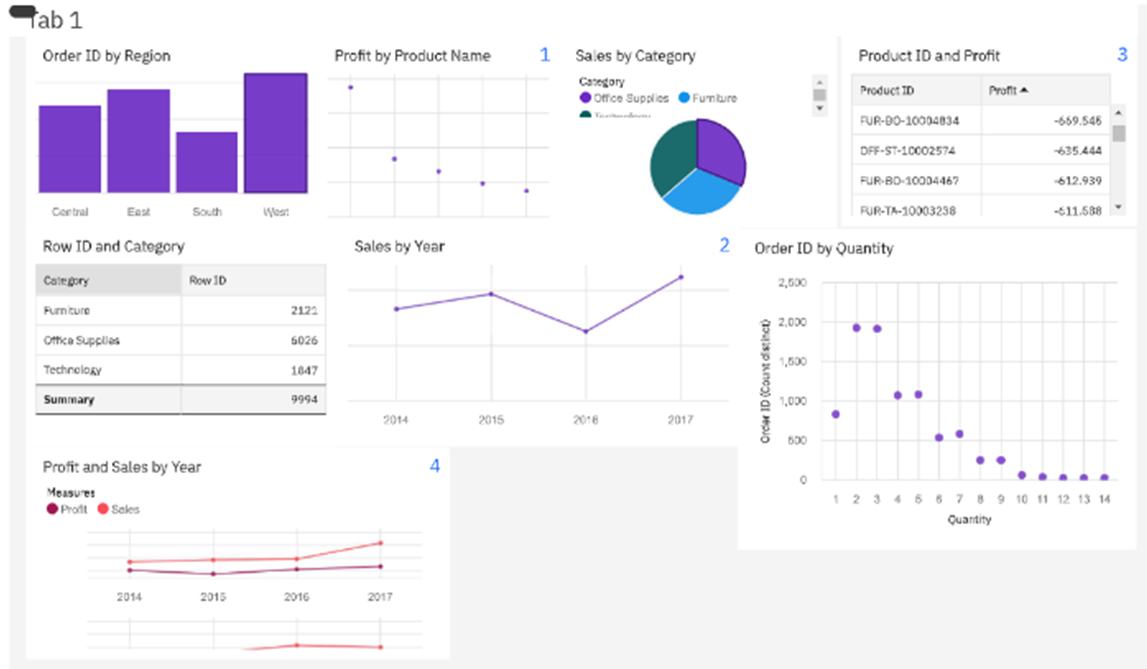
  • Using the analyzed chart creation of a Dashboard is done.
  • Saving and Visualizing the final dashboard in the IBM Cognos Analytics.
  • To accomplish this, we have to complete all the activities and tasks listed below
  • Working with the Dataset
  • Understand the Dataset
  • Build a Data Module in Cognos Analytics.

Understand The Dataset 

The data was sourced from the Kaggle.

Let’s understand the data of the file we’re working with i.e. US Superstore data.csv and give a brief

overview of what each feature represents or should represent

  • Row ID – Unique ID for each entry.
  • Order ID – Unique ID for each order.
  • Order Date – Date on which the order was placed.
  • Ship Date – Date on which the order was shipped.
  • Ship Mode – Mode of shipping the order.
  • Customer ID – Unique ID for each Customer.
  • Customer Name – Name of the Customer.
  • Segment – Segment to which the Customer belongs.
  • Country – Country to which the Customer belongs.
  • City – City to which the Customer belongs.
  • State – State to which the Customer belongs.
  • Postal Code – Postal Code of the Customer.
  • Region – Region to which the Customer belongs.
  • Product ID – Unique ID for each Product.
  • Category – Category to which the product belongs.
  • Sub-Category – Sub-Category to which the product belongs.
  • Product Name – Name of the product.
  • Sales – Sales fetched.
  • Quantity – Quantity of the product sold.
  • Discount – Discount Given.
  • Profit – Profit fetched.

Build A Data Module In Cognos Analytics 

In Cognos Analytics, a Data Module serves as a data repository. It can be used to import external data from files on-premise, data sources, and cloud data sources. Multiple data sources can be shaped, blended, cleansed, and joined together to create a custom, reusable and shareable data module for use in dashboards and reports.

Visualization Of The Dataset 

In Cognos, we can create different numbers of visualization and in the data exploration part we will be going to plot multiple data visualization graphs for getting the insights from our data and once the explorations are done we will build our dashboard.

Once you’ve loaded all the CSV files on the data module for creating different explorations. 

RESULT

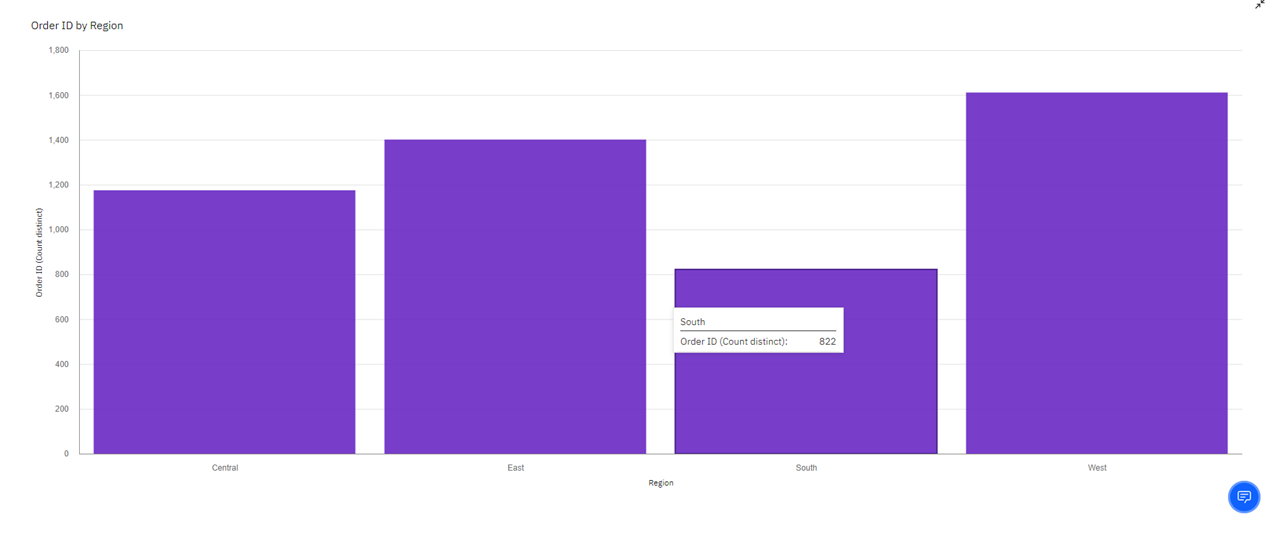
Order Id by Region

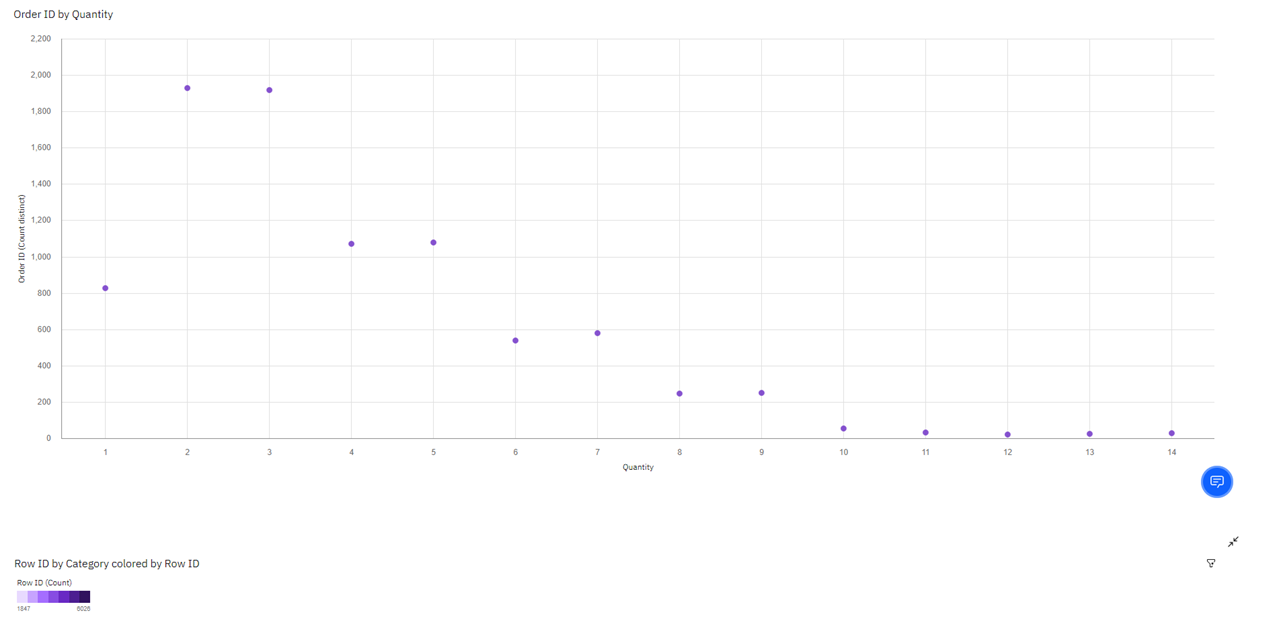
Order ID by Quantity:

Order Id by Quantity

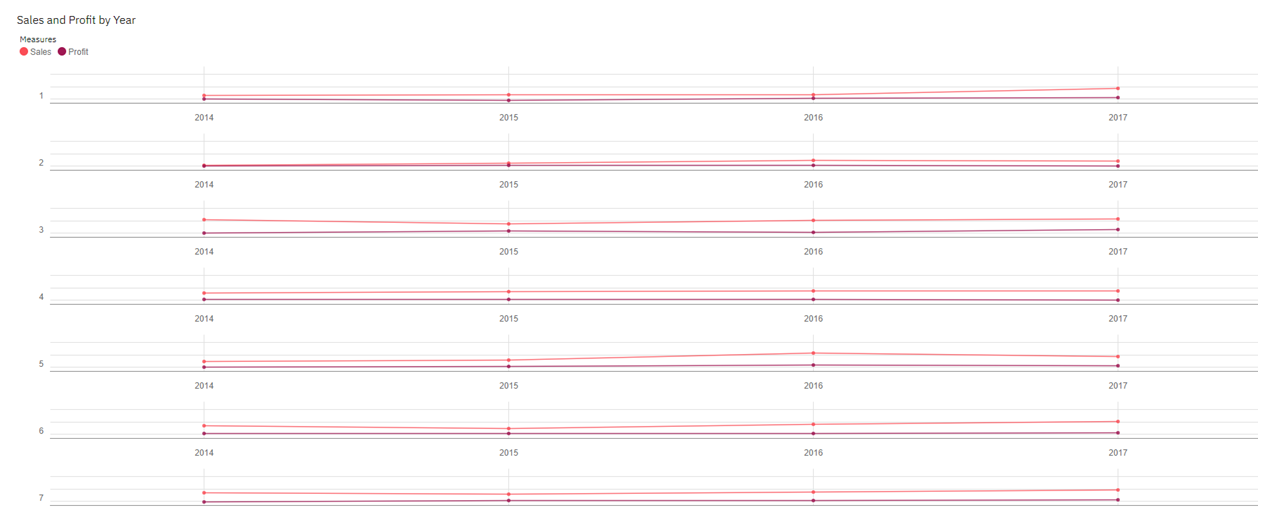
Sales and Profit by Year:

Sales and Profit by Year

Analysing Region Wise E-Commerce Data

Analysing Region Wise E-Commerce Data Using IBM Cognos Dashboard

CONCLUSION

From this Analysing E-Commerce Data project, we have successfully:

  • Created multiple analysis charts/graphs
  • Used the analyzed chart creation of a dashboard
  • Saved and visualized the final dashboard in the IBM Cognos Analytics

Airbnb User Bookings Prediction Project Synopsis

Airbnb User Bookings Synopsis

1. Objective of work

The main objective of this project is to predict where will new guest book their first travel experience. 

2. Motivation

This project helps Airbnb to better predict their demand and take consequent informed decisions. Earlier a new user was overwhelmed with the various choices available for a perfect vacation or stay.

By predicting where a new user will book their first travel experience the company is better able to inform its users by sharing personalized content with their community. It will drastically decrease the time to first booking which will increase the company’s output and help them gain popularity among its user and an edge over its competitors in the market. 

3. Target Specifications if any

Predicting where a new guest books their first travel experience. 

4. Functional Partitioning of the project

4.1 Research and gaining knowledge

Undertaking various courses and familiarizing ourselves with the working process of Data Science problems. Exposure and exploration of the Kaggle website, understanding kernels, and datasets. Learning the prerequisites: programming in Python, and Pandas along with Machine Learning algorithms and data visualization methods.

4.2 Frequent Discussions and Guidance

Frequent discussions with our mentor along with his guidance in the same will allow us to work in the right direction and take informed decisions.

 4.3 Applying the knowledge gained

After much exposure to this field and gaining the knowledge, we will now apply our skills to real-life problems and contribute to society.

5. Methodology

5.1 Using the Kaggle platform

In the test set, we will predict all the new users with their first activities after 7/1/2014.In the sessions dataset, the data only dates back to 1/1/2014, while the user’s dataset dates back to 2010. Taking the help of the Kaggle platform for testing out datasets as it is not feasible to have a large dataset say 1TB be stored in a local machine.

5.2 Working on the dataset

 Using the dataset and studying various patterns of users’ first booking after signing up with Airbnb from different countries. Next plot out the observed and collected information. We can then apply various Machine Learning algorithms and calculate prediction scores. Finally, choose the algorithm with the highest score to recommend to users which are from that country the destinations that have been frequently used by travelers belonging to that region.

5.3 Submitting our work on the Kaggle platform

The result can now finally be uploaded on the platform and be used by Airbnb to better connect with their users.

6. Tools required

6.1 Kaggle Kernels

Kaggle is a platform for doing and sharing Data Science. Kaggle Kernels are essentially Jupyter notebooks in the browser that can be run right before your eyes, all free of charge. The processing power for the notebook comes from servers in the cloud, not our local machine allowing us to experience Data Science and Machine Learning without burning through the laptop’s battery and space.

6.2 Dataset

Airbnb will be providing us with the dataset, which would contain: Airbnb will be providing us with the dataset, which would contain

  • csv-the training set of users
  • csv-the test set of users
  • csv-web sessions log for users
  • csv-summary statistics of destination countries in this dataset and their locations
  • csv-summary statistics of users’ age group, gender, and country of destination.
  • csv-correct format for submitting our predictions

7. Work Schedule

(a) January

Enroll and start the course on Machine Learning using Kaggle. Start recapitulating the basics of Python and its various libraries such as NumPy, pandas, etc.

(b) February

End course and start analyzing the dataset

(c) March

Start coding and implementing various algorithms for the prediction

(d) April

Pick the final algorithm by trial and test and finish coding

(e) May

Appropriate documentation and upload our solution