AI4Jobs: A Machine Learning Framework for Fake Recruitment Detection in Online Portals

AI4Jobs: A Machine Learning Framework for Fake Recruitment Detection in Online Portals

Abstract

With the growing influence of online job portals and recruitment platforms, fake job postings have become a major cyber threat, targeting job seekers and exploiting their personal information. This project proposes a machine learning-based system to automatically detect fake job postings using NLP and classification algorithms. By analyzing job descriptions and related metadata, the system leverages models like Logistic Regression, Random Forest, SVM, and others to classify whether a job post is genuine or fraudulent. The proposed model achieves high accuracy and enables real-time detection through a web interface built using Flask.

Introduction

In the digital age, job seekers often rely on online platforms for career opportunities. However, cybercriminals exploit this reliance by posting fraudulent job advertisements to collect sensitive information or extort money. Manual detection is inefficient due to the massive volume of listings. This system employs machine learning models to automate the classification of job postings as real or fake, ensuring a secure recruitment experience. It uses data pre-processing, TF-IDF feature extraction, and various supervised learning techniques to achieve accurate predictions.

Problem Statement

How can we accurately detect and classify fake job postings using automated systems that analyze textual content and metadata, in order to protect users from employment fraud?

Existing System and Disadvantages

Existing Systems:

  • Manual moderation of job posts
  • User reporting systems
  • Simple keyword filters or rule-based checks

Disadvantages:

  • Time-consuming and error-prone
  • Inability to scale to thousands of posts per day
  • High false negatives and low detection rates

Proposed System and Advantages

Proposed System:

  • A machine learning pipeline using Natural Language Processing (NLP) for text-based analysis
  • Multiple ML classifiers trained on historical job posting data
  • Flask-based web interface for user interaction and prediction

Advantages:

  • Automated, real-time detection of fake job posts
  • High classification accuracy using ensemble ML techniques
  • Scalable and adaptive to new data
  • Protects users from scams and identity theft

Modules

  1. Data Pre-processing Module
    • Cleans and prepares data by handling missing values and irrelevant features
  2. Feature Extraction Module
    • Applies TF-IDF to convert job descriptions into numerical vectors
  3. Model Training Module
    • Trains multiple models (Naive Bayes, SVM, Random Forest, etc.) on labeled data
  4. Prediction Module
    • Provides predictions for new job posts through the trained models
  5. Visualization & Analysis Module
    • Displays confusion matrix, accuracy graphs, and classification reports
  6. Web Interface Module (Flask)
    • Allows users to input job descriptions and get results

Algorithms / Models Used

  • Logistic Regression
  • Random Forest
  • Support Vector Machine (SVM)
  • Decision Tree
  • K-Nearest Neighbors (KNN)
  • Naive Bayes
  • TF-IDF Vectorization for text processing

Software Requirements

Component

Technology

Frontend

HTML, CSS, JavaScript

Backend

Python, Flask

Database (Optional for logging)

MySQL

Libraries

scikit-learn, pandas, matplotlib, joblib, seaborn

Hardware Requirements

Component

Specification

Processor

Intel i3 or above

RAM

4GB minimum

Storage

100MB (for dataset and models)

OS

Windows/Linux/Mac

Conclusion

The project successfully demonstrates the use of machine learning to detect fake job postings with high accuracy. By analyzing textual data from job advertisements, the system can proactively classify fraudulent content and prevent potential exploitation of job seekers. The implementation of multiple ML models provides comparative performance insights, with ensemble models like Random Forest and SVM showing the best results.

Future Enhancement

  • Integrate deep learning models (LSTM or BERT) for better contextual understanding
  • Build an alert system to flag suspicious postings automatically on job portals
  • Include user feedback loops to improve model retraining
  • Extend support for multi-language job postings
  • Add database integration for storing logs and user sessions

AGRICULTURE LAND CLASSIFICATION USING DEEP LEARNING

AGRICULTURE LAND CLASSIFICATION USING DEEP LEARNING

Abstract

Land cover classification is a fundamental task in remote sensing used for mapping different types of land surfaces such as forests, urban areas, water bodies, and agricultural land. This project leverages deep learning, specifically the U-Net++ architecture with EfficientNet-B3 encoder, to accurately classify satellite images. A Flask-based web application enables users to upload satellite images and view segmented output along with land distribution analysis. The model also computes and visualizes the percentage coverage of each land category in a given image, facilitating better understanding and decision-making for environmental monitoring and land use planning.

Introduction

Monitoring and managing land resources is vital in the context of urbanization, agriculture, deforestation, and environmental sustainability. Satellite imagery, combined with advanced deep learning techniques, provides a scalable solution for automatic land cover classification. Traditional classification methods often require extensive manual efforts or lack precision. This project addresses these limitations by integrating a deep learning segmentation model (U-Net++) into a user-friendly web interface for real-time land classification and analysis.

Problem Statement

Conventional land cover classification techniques struggle with:

  • Inconsistent accuracy across varying landscapes
  • Lack of scalability for large-scale monitoring
  • Minimal interactivity and user engagement in existing tools

There is a need for an automated, accurate, and interactive system that classifies land cover from satellite imagery and provides analytical insights to support planning and monitoring.

Existing System and Its Disadvantages

Existing Systems:

  • Manual classification or semi-automated tools in GIS software
  • Traditional machine learning with handcrafted features
  • Open-source tools lacking interactivity or model flexibility

Disadvantages:

  • Require domain expertise and manual labeling
  • Lack adaptability to new or unseen landscapes
  • Minimal support for live image upload and result visualization
  • Poor performance in noisy or complex regions

Proposed System and Its Advantages

Proposed System: This project proposes a deep learning-based web platform using U-Net++ with EfficientNet-B3 encoder, capable of segmenting satellite images into land cover classes and visually displaying the results.

Advantages:

  • High accuracy through advanced CNN architecture
  • Fully automated segmentation with minimal human input
  • Interactive and easy-to-use web interface
  • Displays land class distribution and charts for visual analytics
  • Supports expansion with more datasets or models

Modules

  1. User Upload Module
    • Upload satellite images and ground truth masks
  2. Pre-processing Module
    • Normalize and resize images using Albumentations
  3. Model Inference Module
    • Predict segmented image using trained U-Net++ model
  4. Postprocessing Module
    • Apply color mapping and calculate land area percentage
  5. Visualization Module
    • Generate bar chart and display results
  6. Web Interface (Flask)
    • Render upload form and prediction results dynamically

Algorithm / Model Used

Model: U-Net++ with EfficientNet-B3 Encoder

  • Encoder: EfficientNet-B3 (pre-trained on ImageNet)
  • Decoder: Nested skip connections (U-Net++)
  • Output: 7-class pixel-wise segmentation
  • Framework: segmentation_models_pytorch

Workflow:

  1. Preprocess input using Albumentations
  2. Pass through U-Net++ for segmentation
  3. Map classes to RGB for visualization
  4. Count pixels for land distribution stats

Software Requirements

  • Python 3.x
  • Flask
  • PyTorch
  • segmentation-models-pytorch
  • OpenCV
  • Albumentations
  • Matplotlib
  • HTML/CSS (Jinja2 templating)

Hardware Requirements

  • GPU (optional but recommended for training)
  • Minimum 8 GB RAM
  • CPU with multi-threading
  • Storage for model and static files

Conclusion

This project successfully demonstrates the power of deep learning for satellite image analysis through land cover classification. The system combines an advanced segmentation model with an intuitive web interface, enabling users to gain insights into land distribution from satellite data. The classification results and area-based analysis empower planners, environmentalists, and researchers to make informed decisions.

Innovative AI and Data Science Projects using Python

Empowering Innovation: AI, ML, DL, and Cyber security Projects for the Future

Project ID Project Name Domain Language
AR-001 Hybrid Image Protection System Using Invisible Watermarking Cyber security/ Image Processing and Security Python
AR-002 Agriculture Land Classification using Deep Learning Deep Learning Python
AR-003 TravelBot-HYD NLP and RNN Based Urban Trip Planner Deep Learning/NLP Python
AR-004 Hyderabad Navigator Chatbot: Intelligent Trip Planning Using NLP and Random Forest Machine Learning/NLP Python
AR-005 Cloth(Fabric) Defect Detection using deep learning and Market Integration Deep Learning Python
AR-006 Stroke Prediction Using Machine Learning Models With Flask And Mysql Integration Machine Learning Python
AR-007 EduAssist: AI-Powered College Enquiry Chatbot Machine Learning/NLP Python
AR-008 AI-Based Healthcare System for Disease Prediction Using CNN and XGBoost with Chatbot Assistance Artificial Intelligence Python
AR-009 Diabetic Retinopathy Detection Using CNN with Inception v2 and Inception v3 Deep Learning Python
AR-010 Automatic Video Dubbing for Indian Regional Languages Artificial Intelligence and Multimedia Processing Python
AR-011 SMS Spam Detection using Machine Learning Machine Learning Python
AR-012 Evaluation of Academic Performance of Students Machine Learning Python
AR-013 Real Time Face Emotions Recognition Artificial Intelligence Python
AR-014 Smart Student Attendance System Integrating QR Codes and Facial Recognition Artificial Intelligence Python
AR-015 Enhancing Image Clarity with GANs A Deep Learning Approach to Super Resolution Deep Learning Python
AR-016 Detect Potato Disease A Deep Learning Approach for Early Detection of Potato Leaf Diseases Deep Learning Python
AR-017 Malaria Detection Using CNN Integrated with an Interactive Chatbot System Deep Learning/NLP Python
AR-018 Measuring Semantic Textual Similarity Using TF-IDF and Cosine Similarity Natural Language Processing  Python
AR-019 Dual-Mode Text Similarity Checker using TF-IDF and GloVe Embeddings in Flask Natural Language Processing  Python
AR-020 Videozen – Protecting Videos with Encryption and Decryption Using a Combination of Blowfish and AES for Security Cybersecurity / Information Security Python
AR-021 PhishNet Detecting Phishing URLs Using Convolutional Neural Networks Deep Learning/CNN Python
AR-022 DeepSpam Neural Network Approach to Detect Spam in YouTube Comments Artificial Neural Network Python
AR-023 SmartLand Real-Time Satellite Image Segmentation and Classification Using YOLOv8 for Sustainable Land Monitoring Deep Learning/YOLO Python
AR-024 DeepPhish Machine Learning Solutions for URL-Based Phishing Detection Machine Learning Python
AR-025 GetStego An Intelligent Web-Based Multimedia Steganography System for Secure Communication Cybersecurity and Information Security Python
AR-026 AI4Jobs A Machine Learning Framework for Fake Recruitment Detection in Online Portals Machine Learning Python
AR-027 Air Canvas Virtual Brushes in the Wind Using Python and OpenCV Artificial Intelligence Python
AR-028 LandMarkAI YOLOv8-Based Satellite Image Analysis for Sustainable Growth Deep Learning Python
AR-029 FitMind AI-Based Fitness and Mental Wellness Recommendation System with Chatbot Support Artificial Intelligence Python
AR-030 Rainfall Prediction Using Ensemble Learning Ensemble Learning Python
AR-031 AI-Based Skin Disease Detection and Patient Engagement System Deep Learning Python
AR-032 Early detection and classification of Alzheimer’s using Machine Learning Machine Learning Python
AR-033 Classification of Surya Namaskar Yoga Asana using Convolutional Neural Networks (CNN) Deep Learning Python
AR-034 Email Spam Detection Using Deep Learning Deep Learning Python

Gym Fitness Management System Python Project using Django, HTML5, CSS, JS, MySQL

Introduction

  • The aim of creating this project is to bring every manual activity of the gym to the website or on the online platform.
  • This helps in making work easy for the gym staff which is lengthy and a little bit complex because of doing it on paper.
  • This website also helps the member of a gym, through this website the members can track their attendance manage their schedule, and many more things which we will discuss further.
  • It also allows guest users to apply for Gym membership directly via the website.
  • Trainers of the gym also can track their attendance and workout details of members via this website.
  • Trainers can prepare workout schedules and diet charts for members via this website.

Entities:

  • Admin
  • Trainer
  • Member
  • Guest

Project Profile

Requirement Gathering:

ADMIN:

Admin is the one who manages the whole website and has every access right to the website. Admin can do the following things:-

  • Admin can log in.
  • Admin can add, update or remove Gym Details.
  • Admin can manage the members and trainers of the Gym.
  • Admin can manage the attendance of members and trainers.
  • Admin can manage memberships.
  • Admin can sell Gym products.
  • Admin can provide fitness blogs and videos.
  • Admin can manage payments.
  • Admin can generate reports.

MEMBER:

Members are like clients of the Gym. Member can also access many things on a website like purchase products, view attendance, etc. member can do the following things:-

  • Member can log in.
  • Member can manage his/her profile.
  • Member can track his/her attendance.
  • Members can watch training videos and workout schedules and diet charts provided by Trainer.
  • Members can buy Gym products.
  • Members can manage payments for membership renewal.
  • Members can provide feedback for the website and Gym.

TRAINER:

Trainers are like employees of the gym. Trainers will do things like managing the workout schedule and diet chart of members. A trainer can do the following things:-

  • A trainer can log in.
  • A trainer can manage his/her own profile.
  • A trainer can view or track the attendance of members and his/her own.
  • A trainer can manage users’ workout schedules and diet charts.
  • Trainers can upload workout videos for users.
  • Trainers can give reward points to members on the basis of their weekly performance.

GUEST

Guests can only serve or see the gym website, he/she can do anything only after registering for the gym and website.
• Guest users can view the website.
• Guest users can register/Apply for a Gym membership
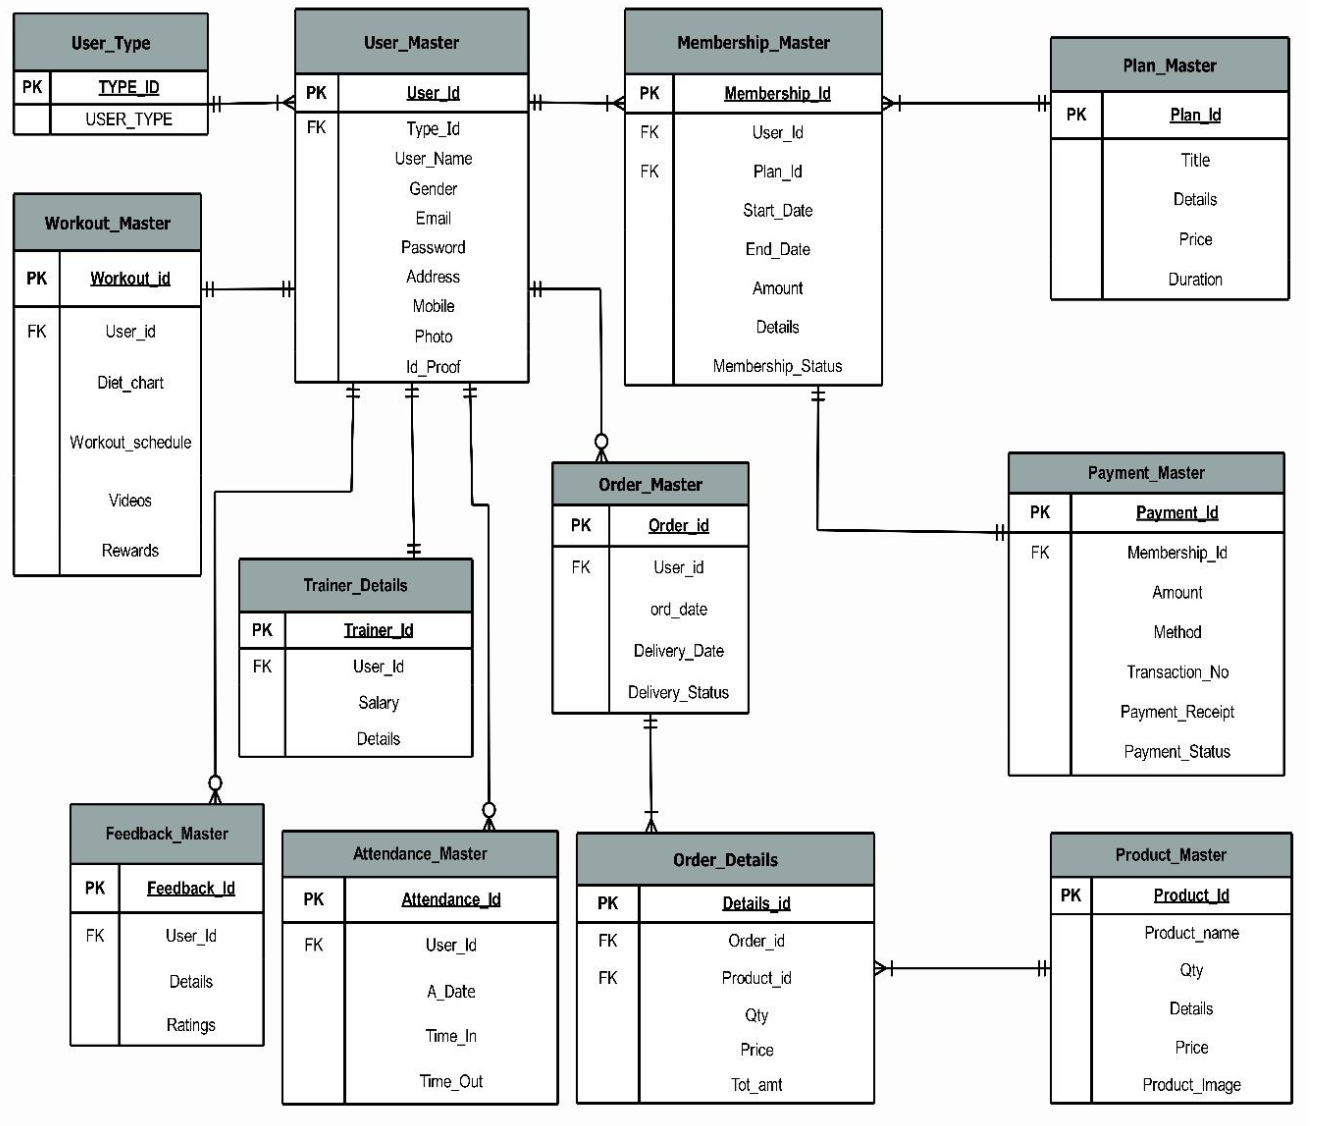
ER Diagram:

Existing System

  • Customer data is stored manually either in registers or in MS Excel.
  • Books are maintained to keep track of Customer attendance.
  • Payment transactions are kept in books.
  • Currently, the GYM does not have any advanced system to manage the GYM.

Proposed System

  • In the new system trainers and members can track their attendance from anywhere.
  • In the new system, a member can get his/her diet chart according to their workout plan.
  • In the new system, members can get a workout schedule from the trainer, while they also get rewards for points for achieving workout targets.
  • In this system, members can watch workout videos provided by their trainers which helps them to do exercise at home.
  • Here members can also purchase gym products.

Tools And Technology Used

FrontEnd: HTML5, CSS 2.1, JS
Backend: Mysql 5.5
Framework: Django 3.1 (Python 3.8)
Other Tools: Microsoft Powerpoint 2019, EDraw max 9.0, Microsoft Visio 2016, and Microsoft Word 2019

Data Dictionary

1) Table Name: User_Type

Table Description: Contains details of user type. It will give information about the type of user whether it is a member, trainer, or admin in the User_Master table.

2) Table Name: User_Master

Table Description: Contains details about users. It will contain all the basic information about users like name, email, gender, address, mobile no. etc along with the type of user.

3) Table Name: Plan_Master

Table Description: Contains details about membership plans. It will contain all the basic details about plans that a member can choose for a gym membership.

4) Table Name: Membership_Master

Table Description: Contains details about members’ memberships. It will contain all information regarding memberships of members according to their chosen plan.

5) Table Name: Trainer Details

Table Description: Contains details about the trainer. It will contain additional details about trainers along with details in the User_Master Table.

6) Table Name: Payment_Master

Table Description: Contains details about payments. It will contain the payment details of Memberships of a member

7) Table Name: Product_Master.

Table Description: Contains details about Gym products. It will contain basic information about products that the admin wants to sell and that a member can buy.

8) Table Name: Feedback_Master

Table Description: Contains details about feedback. It will contain feedback details given by members about the Gym.

9) Table Name: Workout_Master

Table Description: Contains workout details of members. It will contain members’ workout details like diet charts, workout schedules, workout videos, and reward points provided by trainers.

10) Table Name: Order_Master

Table Description: Contains Order Details. It will contain basic order details like which member has made the order, date of placing an order, delivery date, etc. of orders made by members for their purchase of products

11) Table Name: Order_Details

Table Description: It contains order Details. It will contain additional information about orders like the product purchased, the quantity of the product, the Price of the Product, etc. in relation to the Order_Master table.

12) Table Name: Attendance_Master

Table Description: Contains details about the attendance of users. It will contain day-to-day attendance details of members and trainers which will be added by admin.

Modules Functionalities:

ADMIN SIDE:

  • Login page for admin with validations. The email id Field Should not be empty. Email id should match the requested format which contains @ and (.)
  • Admin not allowed to login due to invalid username.
  • Change the Password page of Admin, the retyped password doesn’t match the validation Correct admin username and password:
  • Home page of Admin:
  • Admin dashboard. It Shows Side Panel which directs it to the selected page to be visited. The Page shows the direct link and information of User_type, Users, Trainer details, Attendance, and plans.
  • Add User Type: Admin is adding user type member
  • When the view tab of User type is clicked type of users is shown on this page
  • Add Users window can be opened from the side panel and the Admin can add a new user.
  • View Users window- All the users are shown here to the admin where the admin can take actions like edit and delete.
  • When the view part of Plans in the side menu is clicked plan details are shown.
  • Add Plans window-Admin can add new plan details in this window.
  • Admin can add membership details of the user, here validation is showing where the amount field is required.
  • When viewing a part of Membership Details in the side menu clicked Membership details table is shown
  • Attendance adds window- In add attendance window admin can add attendance details of users.
  • When view part of attendance in the side menu is clicked attendance details of users are shown
  • Then add part of Trainer Details is clicked, Admin can add details of the trainer.
  • View part of Trainer Details where Details of the trainer have been shown.
  • Add payment window is open when adding part of Payment Details is clicked, Admin can approve Payment Status.
  • When the view part of Payment details is clicked Payment Details is shown.
  • Add product window is shown when clicking on the add part of the Products.
  • When the view part of the Products tab is clicked all product details with price and quantity have been shown.
  • Add Workout Details Window – The admin can add Workout Details of a particular user by adding a diet chart, workout schedule, and workout videos for the user.
  • View the Workout Details window where all the details of a user’s workout(including diet chart and schedule) are shown.
  • View Order window – All the details with delivery status are shown in this window.
  • View Feedback window: Admin can view feedback and ratings given by users in this window.

TRAINER SIDE:

  • Trainer Login Page:
  • Trainer dashboard which contains information about trainers with Edit Profile and Change Password Link. It Shows Side Panel which directs it to the selected page to be visited. The Page shows the direct link and information on Attendance and Workout Details.
  • When Change Password Link is clicked, the trainer will be redirected to the Change Password Page where he/she can change their login password:-
  • Change Password Validations:-
  • When the My Attendance part of Attendance in the side menu is clicked attendance details of his/her own are shown:-
  • When the Members Attendance part of Attendance in the side menu is clicked attendance details of the member are shown:-
  • Dashboard Showing Add and View Option in Workout Menu of Side Bar :
  • Add Workout Details Window – The trainer can add Workout Details of a particular user by adding a diet chart, workout schedule, and workout videos for the member.
  • View Workout Details Window: Details of member workouts including diet chart, workout schedule, and total reward points are shown in this window.

GUEST SIDE:

  • HomePage:- The starting point of the website/first page of the website
  • About Options:-
  • About Us page giving information about GYM:-
  • FAQ Page:- It Contains all the frequently asked questions with their answers
  • Testimonial Page:- It contains all the reviews given by the members.
  • Contact Us Page:- It contains all the contact details of the gym.
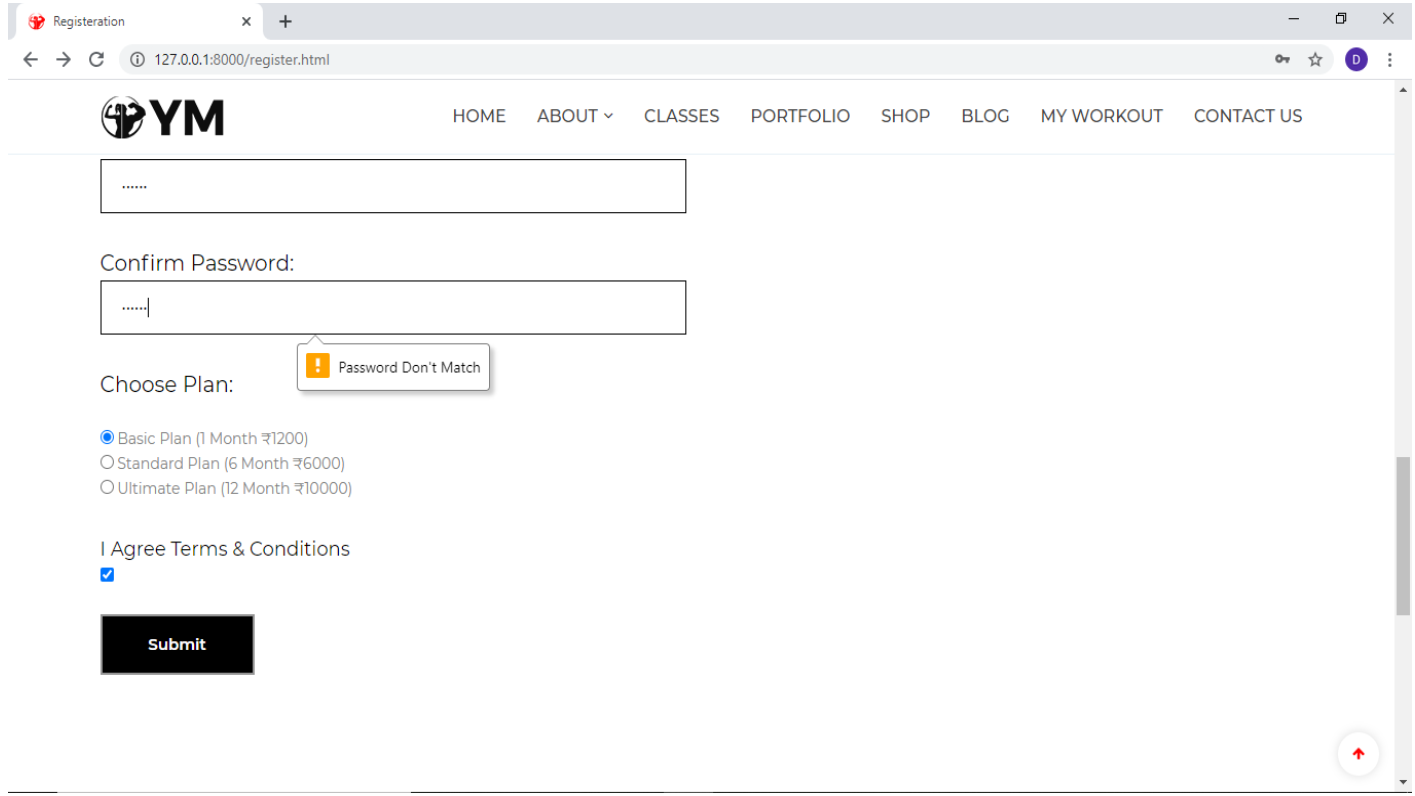
  • When a user clicks on the Apply For Membership tab Registration page is opened which Collects user data for registration so that the user can make a login.
  • Registration Page Showing How to Apply for the GYM Membership.
  • Registration page displaying validation:-
  • After Successfully filling Registration Form, the User will be redirected to the Payment Confirmation Form which will show the user information along with the plan he has chosen while registering then the user has to choose how payment was done, enter transaction no. and has to upload Payment Receipt.
  • When User will successfully submit the payment confirmation form, they will be redirected to the Login page or can open it from Login Tab.
  • Login Page with Validation:-
  • Forgot password? – asking for a registered email ID
  • Password received by the customer through email.

USER SIDE:

  • After Successful Login User will be redirected to the Homepage. The Apply For Membership and Login heading is changed to My Account with Profile, Membership, Attendance, and Logout Options.
  • When the User Clicks on Membership, He/she will be redirected to the membership page which contains the membership details the user.
  • When the User Clicks on the Attendance option in the My Account Section he/she will be redirected to the Attendance Page which contains the attendance details of the user:-
  • Shop Page:- It contains all the products with details that the gym wants to sell.
  • Add to cart option on the product:-
  • Shop Page showing Add to Cart Option for a product:-
  • After clicking add to cart from Shop Page, Cart is opened which shows items in your cart.
  • If the Customer wants to shop for more than one product, he/she can click on Buy More and add other products also.
  • When the User clicks on Proceed to Checkout, the Checkout page is opened which shows order details and Billing details and gives the summary of your orders.
  • After clicking Place order, the user is provided with the appropriate order placed message and view order option. On clicking view order user will be shown all the details of his/her orders.
  • When the User Clicks on View Order, he/she will be redirected to My Orders Page which contains all the order details of orders made by the member.
  • When the user Clicks on More details, he/she will be redirected to the order details page which contains additional details about the order.
  • My Workout Page:- It will give the user his/her option to download his/her diet chart, workout schedule, and workout videos provided by the trainer
  • Blog Page:- It contains all the fitness blogs that users can read.
  • Homepage showing My Account Section having Options Profile, Membership, Attendance, Logout:-
  • On clicking the Profile Option in the My Account Section, the User will be redirected to the My Account Page which contains all details of the currently Logged In User like name, address, gender, email, mobile, etc. with the Edit Profile/Change Password Option.
  • When the User Clicks on Change Password, he/she will be redirected to the Change Password Page where the user can change his/her old password new password.
    Change password Validations:-
  • Showing Logout Option In My Account Menu:-
  • When the User Clicks on Logout, he/she will be redirected to Login Page.
  • Report of all the users registered with Dynamo Fitness.
  • Various Filters for user reports like reports based on user type, i.e. members or trainers, and reports based on gender.
  • Report after using the user type and gender filter it will show only gym members who are female as we used the user type filter as members and gender filter as female.
  • Report on Current plan and membership of the members it displays the name and plan type of members.
  • Membership report using start date filter for plans starting date.
  • The report shows the list of members whose memberships start in a selected month.
  • Filter based on plan title i.e. basic, standard, and ultimate plan.
  • list of members who are registered with the standard plan.
  • Report after using the print option, the report shows the member with their specific plan with a start date and end date of the plan.
  • Report for the feedback given by users with filters that are gender and ratings.
  • Report using a rating filter, it will display users with specific ratings.
  • Report showing list of users given rating 9.
  • Feedback report after selecting the print option.
  • PDF view of feedback report using the view pdf option.
  • Product order report showing user id with the product they ordered
  • A report showing a filter of product names with different products available.
  • Reports after applying the product name filter i.e. dumbells will show the product id and user id of the users who ordered them.
  • Report after using a filter with the Delivery status it displays the product which is delivered.
  • The attendance report shows the attendance of users that are members and trainers on day to day basis.
  • The filter of the Attendance report is based on the user type i.e. Member and Trainer.
  • The attendance report on the base of the trainer filter displays only trainer attendance.
  • Report after selecting the print option.
  • Date filter option for a report which shows the attendance of users of a specific date.
  • Report After Filter By Attendance Date and Gender

CONCLUSION

The entire duration of this project has been a great learning experience for us. It has introduced us to the working of real-life projects and taught us to face obstacles while developing them. By developing this web application, we hereby conclude that at Gym Management we have achieved our aim at the following:

1) Building a platform where people can apply for a GYM Membership at any place and start their workout activities even at Home.
2) We believe that this website has made it easier for the GYM Owner to manage the information regarding different aspects of the Gym.
3) This website has also made it easier for trainers to manage the workout activities of members. We also hope to expand the scale of the project and make it ubiquitous by developing it for all digital platforms.

Download the complete project on Gym Fitness Management System Project using Python, MySQL, and Django Framework.

Decision Model for Prediction of Movie Success Rate Data Mining J Component Project

ABSTRACT

The purpose of this Movie Success Rate Prediction project is to predict the success of any upcoming movie using Data Mining Tools. For this purpose, we have proposed a method that will analyze the cast and crew of the movie to find the success rate of the film using existing knowledge. Many factors like the cast (actors, actresses, directors, producers), budget, worldwide gross, and language will be considered for the algorithm to train and test the data. Two algorithms will be tested on our dataset and their accuracy will be checked.

 LITERATURE REVIEW

  • They developed a model to find the success of upcoming movies based on certain factors. The number of audience plays a vital role in a movie becoming successful
  • The factorization Machines approach was used to predict movie success by predicting IMDb ratings for newly released movies by combining movie metadata with social media data
  • Using the grossattribute as a training element for the model. The data are converted into .csv files after the pre-processing is done
  • Using S-PLSA – the sentiment information from online reviews and tweets, we have used the ARSA model for predicting the sales performance of movies using sentiment information and past box office performance.
  • A mathematical Model is used to predict the success and failure of upcoming movies depending on certain criteria. Their work makes use of historical data in order to successfully predict the ratings of movies to be released
  • According to them, Twitter is a platform that can provide geographical as well as timely information, making it a perfect source for spatiotemporal models.
  • The data they collected was gathered from Box Office Mojo and Wikipedia. Their data was comprised of movies released in 2016
  • Initially having a dataset of 3183 movies, they removed movies whose budget could not be found or missed key features in the end a dataset of 755 movies were obtained. After Key feature extraction was completed.
  • some useful data mining on the IMDb data, and uncovered information that cannot be seen by browsing the regular web frontend to the database.
  • According to their conclusion, brand power, actors or directors isn’t strong enough to affect the box office.
  • Their neural network was able to obtain an accuracy of 36.9% and compromising mistakes made within one category an accuracy of a whopping 75.2%
  • They divided the movies into three classes rise, stay, and fall finding that support vector machine SMO can give up to 60% correct predictions
  • The data was taken from the Internet Movie Database or IMDb as the data source, the data they obtained was from the years 1945 to 2017.
  • A more accurate classifier is also well within the realm of possibility, and could even lead to an intelligent system capable of making suggestions for a movie in preproduction, such as a change to a particular director or actor, which would be likely to increase the rating of the resulting film.
  • In this study, we proposed a movie investor assurance system (MIAS) to aid movie investment decisions at the early stage of movie production. MIAS learns from freely available historical data derived from various sources and tries to predict movie success based on profitability.
  • The data they gathered from movie databases was cleaned, integrated, and transformed before the data mining techniques were applied.
  • They used feature, extraction techniques, and polarity scores to create a list of successful or unsuccessful movies. This was done by gathering the data using IMDb and YouTube.

PROBLEM STATEMENT

in this Movie Success Rate Prediction project, The method of using the ratings of the films by the cast and crew has been an innovative and original way to solve the dilemma of film producers. Film producers have often trouble casting successful actors and directors and still trying to keep a budget. Looking at the average ratings of each actor and director together with all the films they participated in should be able to give the producer a good idea of who to cast and who not to cast in a film that is to be out right now.

Implementation:

  • Data Preprocessing & Correlation Analysis
  • Application of Decision Tree Algorithm
  • Application of Random Forest Algorithm

RESULTS & CONCLUSION

After testing both the algorithms on the IMDb dataset i.e. Decision Tree and Random Forest algorithm, we found that the Random Forest algorithm got a better accuracy (99.6%) on the data rather than the decision tree algorithm in which we obtained just 60% accuracy.

Predict the Forest Fires Python Project using Machine Learning Techniques

Predict the Forest Fires Python Project using Machine Learning Techniques is a Summer Internship Report Submitted in partial fulfillment of the requirement for an undergraduate degree of  Bachelor of Technology In Computer Science Engineering. I submit this industrial training workshop entitled “PREDICT THE FOREST FIRES” to the University, Hyderabad in partial fulfillment of the requirements for the award of the degree of “Bachelor of Technology” in “Computer Science Engineering”. 

Apart from my effort, the success of this internship largely depends on the encouragement and guidance of many others. I take this opportunity to express my gratitude to the people who have helped me in the successful competition of this internship.

I would like to thank the respected faculties who helped me to make this internship a successful accomplishment.

I would also like to thank my friends who helped me to make my work more organized and well-stacked till the end.

OBJECTIVE OF THE PROJECT:

This is a regression problem with clear outliers which cannot be predicted using any reasonable method. A comparison of the three methods has been done :

(a) Random Forest Regressor,
(b) Neural Network,
(c) Linear Regression

The output ‘area’ was first transformed with an ln(x+1) function.

One regression metric was measured: RMSE and r2 score is obtained. An analysis of the regression error curve(REC) shows that the RFR model predicts more examples within a lower admitted error. In effect, the RFR model predicts better small fires, and the r2 score is obtained by using Linear Regression.

Best Algorithm for the project:

The best model is the Random Forest Regressor which has an RMSE value of 0.628 for which we are using GridSearchCV.

Scikit-learn has the functionality of trying a bunch of combinations and seeing what works best, built-in with GridSearchCV. The CV stands for cross-validation.

MODEL BUILDING

PREPROCESSING OF THE DATA:

Preprocessing of the data actually involves the following steps:

GETTING THE DATASET:

we can get the data from the client. we can get the data from the database.
https://archive.ics.uci.edu/ml/datasets/forest+fires

IMPORTING THE LIBRARIES:

We have to import the libraries as per the requirement of the algorithm.

IMPORTING THE DATA SET:

Pandas in python provide an interesting method read_csv(). The read_csv function reads the entire dataset from a comma-separated values file and we can assign it to a DataFrame to which all the operations can be performed. It helps us to access each and every row as well as columns and each and every value can be accessed using the data frame. Any missing value or NaN value has to be cleaned.

HANDLING MISSING VALUES:

OBSERVATION:

As we can see there are no missing values in the given dataset of forest fires

DATA VISUALIZATION:

  • scatterplots and distributions of numerical features to see how they may affect the output ‘area’
  • Boxplot of how categorical column day affects the outcome
  • Boxplot of how categorical column month affects the outcome

CATEGORICAL DATA:

  • Machine Learning models are based on equations, we need to replace the text with numbers. So that we can include the numbers in the equations.
  • Categorical Variables are of two types: Nominal and Ordinal
  • Nominal: The categories do not have any numeric ordering between them. They don’t have any ordered relationship between each of them. Examples: Male or Female, any color
  • Ordinal: The categories have a numerical ordering between them. Example: Graduate is less than Post Graduate, Post Graduate is less than Ph.D. customer satisfaction survey, high low medium
  • Categorical data can be handled by using dummy variables, which are also called indicator variables.
  • Handling categorical data using dummies: In the panda’s library, we have a method called get_dummies() which creates dummy variables for those categorical data in the form of 0’s and 1’s.
  • Once these dummies got created we have to concat this dummy set to our data frame or we can add that dummy set to the data frame.
  • Categorical data-column ‘month
  • dummy set for column ‘month’
  • Categorical column-‘day’
  • dummy set for column ‘day’
  • Concatenating dummy sets to a data frame
  • Getting dummies using label encoder from scikit learn package
  • We have a method called label encoder in scikit learn package. we need to import the label encoder method from scikitlearn package and after that, we have to fit and transform the data frame to make the categorical data into dummies.
  • If we use this method to get dummies then in place of categorical data we get the numerical values (0,1,2….)
  • importing label encoder and one hot encoder
  • Handling categorical data of column month
  • Handling categorical data of column day

TRAINING THE MODEL:

  • Splitting the data: after the preprocessing is done then the data is split into train and test set
  • In Machine Learning in order to access the performance of the classifier. You train the classifier using a ‘training set’ and then test the performance of your classifier on an unseen ‘test set’. An important point to note is that during training the classifier only uses the training set. The test set must not be used during the training of the classifier. The test set will only be available during the testing of the classifier.
  • training set – a subset to train a model. (Model learns patterns between Input and Output)
  • test set – a subset to test the trained model. (To test whether the model has correctly learned)
  • The amount or percentage of Splitting can be taken as specified (i.e. train data = 75%, test data =25% or train data = 80%, test data= 20%)
  • First we need to identify the input and output variables and we need to separate the input set and output set
  • In scikit learn library we have a package called model_selection in which the train_test_split method is available. we need to import this method
  • This method splits the input and output data to train and test based on the percentage specified by the user and assigns them to four different variables(we need to mention the variables)

 EVALUATING THE CASE STUDY:

Building the model (using splitting):

First, we have to retrieve the input and output sets from the given dataset

  • Retrieving the input columns
  • Retrieving output column

MODEL BUILDING:

  • Defining Regression Error Characteristic (REC)

Download the complete project Code, Report on Predict the Forest Fires using Project using Machine Learning Techniques

Analysis Of Energy Consumption In India Python Project

Energy is one of the most important resources available to man and it is necessary to keep a check on the growing need for energy day by day.

The Issue of the availability of Energy is getting prominent these days. So to analyze the consumption of energy and production of Energy via available Energy Resources is important.

The project describes the consumption of energy resources of all states of India in the last few years with respect to the population of India state-wise and predicts the future energy requirements for every state.

INTRODUCTION

India is a growing economic superpower. At this point in time, we are sitting at the tip of our economic explosion. The vast reserves of resources in all factors of production have earned us the title of The Land of Potential. But this comes at a cost, with this growth potential comes the need to satisfy the potential through the generation of energy.

To meet this challenge of growing energy is very important for India and it is even more important to predict the future requirements of energy in our country.

If we are able to predict the energy required in the future it will boost the potential of the country and increase the overall growth in every field

Background and Basics:

The programming language Python is very useful for the analysis of data in every field.
Python has been used to show the analysis of data in a diagrammatical format like a Pie Chart, Bar Chart, and Multiple Bar Chart.
It also shows a map of India with respect to the intensity of Energy Consumption as well as the Population of India state-wise. By using Machine Learning.
We have predicted the requirement of the amount of energy for every state using The Linear Regression Machine Learning Algorithm. It uses two parameters on the outcome and one on which the outcome depends
The population has been used as a parameter on which energy depends

Future Use

This program gives a clear idea about the energy requirement in the Future.

Software and Hardware Requirements

Details of software

Python
Anaconda (Spyder) IDE
Required Python Libraries:
Numpy
Pandas
Matplotlib
Tkinter
PIL
Mpl_toolkits.basemapDetails of hardware

Details of Hardware

Working PC

Methodology

The SUBMIT button on the GUI checks the availability of state i.e.it checks the correct state.

The PIE Chart on the GUI plots the energy resource required percentage-wise.
The BAR Chart on the GUI plots the energy resource required percentage-wise.
Flow of Project
Our project takes a dataset of the population from the year 2013 to 2017 and energy requirements in India per state from the year 2013 to 2016.

The data from every set from the years 2013-16 has been used in order to train the machine using linear Regression and data from 2017 for the population has been used in order to test the model to predict the future requirement of energy.

The energy requirements predicted as well as actually have been represented using the map of India i.e. greater the intensity on the map higher the energy required for that state, bar chart, and Pie chart.

Results and Discussion

Pie Chart of Energy Resources of Maharashtra Year 2015
Resource-wise Production of energy

Map of India according to energy consumption

Conclusion

We have used python to show the analysis of data in a diagrammatical format like a Pie Chart, Bar Chart, and Multiple Bar Chart.
It also shows a map of India with respect to the intensity of Energy Consumption as well as the Population of India state-wise.
By using Machine Learning, we have predicted the requirement of the amount of energy in the specified year for each state in India.
Technologies used in the project are Python, Machine learning, and Data Analysis.
This program gives a clear idea about the energy requirement in the Future.

MOODIFY – Suggestion of Songs on the basis of Facial Emotion Recognition Project

Modify is a song suggested that recommends the song to the user according to his mood. ‘Modify’ will do the job leaving the user to get carried away with the music.

I/We, student(s) of B.Tech, hereby declare that the project entitled “MOODIFY (Suggestion of Songs on the basis of Facial Emotion Recognition)” which is submitted to the Department of CSE in partial fulfillment of the requirement for the award of the degree of Bachelor of Technology in CSE. The Role of Team Mates involved in the project is listed below:

  • Training the model for facial emotion recognition.
  • Designing the algorithm for image segregation.
  • Algorithm designing for music player.
  • Graphical user interface designing.
  • Testing the model.
  • Collection of data for model and music player.
  • Preprocessing of the data and images.

Dataset:

The dataset we have used is “Cohn-Kanade”. 
This dataset is classified so we cannot provide the actual dataset but the link for you to download is :
http://www.consortium.ri.cmu.edu/ckagree/index.cgi
And to read more about the dataset you can refer to:
http://www.pitt.edu/~emotion/ck-spread.htm

Feature Extraction and Selection:

1. Lips
2. Eyes
3. Forehead
4. Nose

These features are processed by CNN layers and then selected by the algorithm and then they are converted to a NumPy array then the model is trained by that and the following three classifications are made.

How this project works:

  • First Open the Application, CHOOSE THE MODE IN WHICH YOU WANT TO LISTEN to THE SONG
  • Then it shows “YOUR MOOD, YOUR MUSIC”
  • Press “OKAY TO CAPTURE THE IMAGE”
  • After that press “c” to capture
  • You seem Happy please select your favorite genre
  • You seem Excited please select your favorite genre
  • You Seem Sad please select your favorite genre

CODE DESCRIPTION

  • All libraries are imported into this.
  • Model Initialization and building.
  • Training of test and testing.
  • Training our model
  • Model Building, Splitting of test and train set, and training of the model.
  • Saving a model.
  • Loading a saved model.
  • Saving image with OpenCV after cropping and loading it and then the prediction
  • Suggesting songs in Offline mode
  • Suggesting songs online(Youtube)
  • Rest of the GUI part
  • Variable Explorer

IPython Console

  • Importing Libraries
  • Model Training
  • Model Summary
  • Online Mode
  • Offline Mode

GUI

  • Splash Screen
  • Main Screen
  • Selection screen
  • Display songs and then select them, after that they will play

Summary

We successfully build a model for Facial Emotion Recognition(FER) and trained it with an average accuracy over various test sets of over 75%. Then we successfully build a Desktop application to suggest songs on the basis of their facial expression and hence completed our project. This FER model can be widely used for various purposes such as home automation, social media, E-commerce, etc and we have the motivation to take this project to a next level.

Download the complete Project code, report on MOODIFY – Suggestion of Songs on the basis of Facial Emotion Recognition Project

Implementation of E-voting Machine Project using Python and Arduino

INTRODUCTION

Our E-voting Machine project is very useful, This Project was implemented using Python and Arduino. The user is no longer required to check his register in search of records, after the voting procedure gets over, the admin will be able to calculate the total number of votes in just one click since the entire work is done using computers. The user just needs to enter his/her unique voter ID.

In today’s world, no one likes to manually analyze the result after the voting procedure gets over because the process is time-consuming and of which results get usually delayed. Everyone wants his/her work to be done by computer automatically and displaying the result for further manipulations. So this E-voting Machine project is about providing convenience regarding voting.

OBJECTIVE

  • Our objective for the E-voting Machine project is to make a user-friendly Electronic Voting Machine that makes the current voting process faster, easier, and error-free.
  • We have used Arduino in our project for the implementation of push buttons and Python as a programming language.

PROBLEM STATEMENT 

The problem statement was to design a module:

  • Which is a user-friendly E-voting Machine
  • Which will restrict the user from accessing other users’ data.
  • Which will ease the calculations and storage of data.
  • Which will help the jury to declare the result without any biasing.

FUNCTIONS TO BE PROVIDED:

The E-voting Machine system will be user-friendly and completely secured so that the users shall have no problem using all options.

  • The system will be efficient and fast in response.
  • The system will be customized according to needs.

FOR e-VOTING SYSTEM

  • (Check
  • Store
  • )

SYSTEM REQUIREMENTS

  • Programming Language Used: Python, C
  • Hardware Used: Arduino UNO
  • Components Used: Push buttons, Connecting Wires, Resistances(100k ohm), Breadboard
  • Software Used: Anaconda 2.7.x, Python 2.7.x, Arduino IDE
  • Modules Used: Serial, SQLite, Tkinter, tkMessageBox

WORKING

  • The user has to enter his/her ID in the system.
  • After verifying the user ID, the system will show a message that whether a user is eligible to vote or not after checking his/her details stored in the system.
  • A message will be displayed accordingly. The user will then have to press the button against which the name of the candidate is written and whom he/she wants to vote.
  • The votes hence are stored in the database and the results will be announced accordingly.

FUTURE SCOPE OF THE PROJECT

My project “e-VOTING SYSTEM” will be a great help in conducting voting at various organizations. So the modifications that can be done in our project is to add one major change which can be done in this project is to add the data of the voters. This will result in the total identification of the voter.

CONCLUSION

From this E-voting Machine project, we can conclude that this program is very useful in conducting the voting procedures smoothly. It provides easy methods to analyze the voting result. It helps in conducting faster, more secure, and more efficient voting. The program can be used per the norms of the voting requirements.

Download the complete project code, report, and PPT on E-voting Machine using Python and Arduino.

Competitive Programming Platform for Students Project Synopsis

Introduction

Most of the major IT corporations are leveraging online coding competitions to judge the pressure handling and fundamentals of upcoming software engineers. This has led to a significant increase in the number of online judges and coding competitions. Most of the students are now confused, about which platform they should opt for and how to approach these coding contests on time, every time. This is where the Competitive Programming Platform comes into the picture.
A competitive Programming Platform is a collection of extensions, APIs, bots, and web apps aimed to simplify competitive programming. With this project, students can observe, compare, shortlist and outperform these online judges and compare the improvements and achievements with their peers in a healthy environment. Technologies that we’ll be using in this Competitive Programming Platform project will be Python, Javascript, Node, Flask, Selenium, VueJS, and Tailwind.

Objectives

The main objective is to create a platform on which students can easily select and prepare for online coding competitions in the best possible way.
The key objectives of the Competitive Programming Platform are:
1. Looking at all the competitive profiles at a glance.
2. Get updates about the latest programming contests.
3. Getting all the updates through an email newsletter and push notification.
4. Fetching global and local leadership.
5. VS code extension to speed up local development.
6. Chrome extension to view upcoming contests on the go.
7. Standalone REST API.

Methodology

In the first step, we will scrape the data from various resources using a crawler built in Python with Selenium. We will store this data in our database and create a pipeline with a cronjob every six hours.
Now we will deliver all the extracted data through our SPA using VueJS. We will use Workbox 6.0 to convert our SPA into a Progressive Web Application and natively support push notifications.

Web Scrapping: Web scraping is an automatic method to obtain large amounts of data from websites.
Cronjobs in recurrent pipelines: A cron job is normally used to schedule a job that is executed periodically. In our case, we use a cronjob to run our python script that will fetch, and extract unstructured HTML data, validate it and save it in our required database.
User interfaces: Building user-friendly interfaces that bring meaning to our extracted data and visualize it through various tables, charts, and graphs.

Work Flow

Facilities required

• Vue, Tailwind, ChartJS, Babel, GSAP, Node
• Flask, Postgre, Selenium, Python
• Git, GitHub, CodeQL, VS Code
• NGINX, PM2, Travis, Certbot

Expected Outcome

• Responsive, minimalistic user interface with a clutter-free user experience.
• Powerful REST API that can power other third-party applications.
• Healthy competitive environment with ’ friendly competition’ among peers and making competitive programming a constructive habit.