IP telephony application in MANET

Three scenarios are created to understand the quality of service requirements for voice application across the MANETs and among these three scenarios a low quality speech application is used for the first scenario, IP telephony application is used for the second scenario and a GSM quality speech is used for the third scenario.

Performance of these applications is estimated against the quality of service requirements using the voice and wireless LAN metrics and based on the results it is clear that GSM quality speech has shown the maximum QoS standards when compared to the other scenarios.

When the voice metrics like jitter, MOS, traffic sent and traffic received are considered the GSM quality speech has shown the optimal performance and IP telephony has consumed more resources in terms of bandwidth and the quality of service requirements has reduced a lot with the IP telephony.

When the wireless LAN metrics like delay, medium access delay, load, network load, retransmission attempts and throughput are considered the IP telephony has reduced the quality of service requirements and again the GSM quality has shown the optimal performance and thus with this it is concluded that GSM quality level applications are used to enhance the quality of service requirements in the voice applications and IP telephony need to be fine tuned in lot of aspects to improve the quality of service requirements. 

Voice Chats across the Wireless Networks

Voice applications has gained a lot of importance these days and most of the service providers are offering a wide range of voice applications in terms of voice chats across the wireless networks. There are many voice applications used across the wired and wireless networks and the most common among them are Skype, Gtalk and Yahoo messenger and most of these voice applications run purely on the lever of quality of service requirements provided by the service providers.

In general there are many issues with these voice applications in terms of quality of service and common among them are jitter, MOS value and traffic aspects and all these should be considered to ensure the maximum quality of service requirements. In this project this point is considered as the main aim and the quality of service requirements for voice applications wireless LAN is evaluated.

A simple wireless LAN based MANET is used for the simulation and the simulation is done using the OPNET modeler and based on the results it is clear the quality of service requirements is analyzed. Three scenarios are considered across the simulation, where the first scenario deals with the low quality speech, IP telephony is used for the second scenario and a GSM quality speech is used across the third scenario and few Voice and WLAN metrics are used for the results evaluation and the simulation is run for 5 minutes. Based on the results achieved the three scenarios are compared and the key findings are as listed below 

It is observed that the jitter imposed by the IP telephony is more when compared to the other scenarios and even the value is not constant throughout the simulation and there is lot of variations which indicates that there is lot of packet loss with the IP telephony. The overall performance of the GSM quality voice is better when compared to the other scenarios as the speech is suppressed and in this context the overall performance of the application has increased due this low jitter value and thus the quality of service is enhanced is many aspects.

The performance of low quality speech voice application is better than the IP telephony as the quality consumed by a simple speech application is very less and thus the noise across the speech is suppressed at a constant rate and thus the overall quality of service is enhanced. This value is more than the GSM quality as the propagation aspects followed across the GSM are inbuilt with the default quality metrics and thus the overall jitter is very less and constant throughout the simulation.

From this analysis it is clear that the overall quality of service can be improved with the low jitter value and in this context the speech noise depressed and thus GSM has shown a constant jitter and this indicates that the packet delay variation is constant and also the packet delivery is at the idle conditions and thus the overall quality of service is improved.

It is observed that a value of 3.6 is recorded for GSM quality and with this range it is clear that a good quality speech is incurred against the quality of service for voice application where the MOS value for low quality speech is only 2.5 which indicates that a fair quality is incurred with the voice and the MOS value recorded by IP telephony is around 3 and even in this case a fair quality speech is delivered and it can also observed that the MOS value for IP telephony and low quality speech are not constant and they were initially high and later at the end of the simulation their quality has dropped to a bad range.

This indicates that the quality of service requirements for IP telephony and low quality speech are depressed when the communication is proceeding and but with the case of GSM quality speech a constant MOS value is recorded and even this value indicates that a good quality of service requirements are imposed by GSM on the overall network performance. From this analysis it can be concluded that when the MOS value is more the overall quality of service is improved across the voice applications. 

Wireless Network LAN Metrics

Wireless LAN metrics 

Wireless LAN metrics are also included in this simulation process to evaluate the performance of the voice applications. Few metrics that are suited for the quality of service requirements are considered in this performance evaluation and they are listed below 

Delay in seconds 

Delay has the significant role in estimating the quality of service requirements for the voice applications and thus in this context all the three scenarios are considered and the comparison results are given as below. Delay is the actual amount of time take by the packets to be transmitted from source to the destination and this delay indicates the overall packets transmitted to the server by the mobile nodes and if the delay is more the quality is reduced and in this context the comparison graph is as shown below

Delay in seconds

From the graph it is clear that the delay is more with the IP telephony application. When the delay incurred across the network is compared with the three scenarios is compared the overall delay is very less with the GSM speech and this indicates that the voice transmission is very fast at the GSM level and the highest value is more with the IP telephony and an optimal delay is incurred with the low quality speech. When a low quality speech is imposed across the voice the speech quality is increased due to the low noise across the network and the quality of service requirements are imposed due to the GSM quality speech on the network and thus the overall performance of the voice application is increased a lot due to the GSM application. 

Load in bits per second 

Load on the network also indicates the quality of service requirements across the voice application and in this context all the three scenarios are compared to evaluate the load on the network due to different applications on the network. If the load on the network is more then it indicates that the overall quality requirements are reduced a lot and the actual comparison graph is as shown below

 Load in bits per second

From this graph it is clear that the load on the network is more with the IP telephony on the network and a less value is incurred across the GSM network. When the load is compared across the three scenarios it is clear that the overall load on the network is more when the IP telephony is considered as the required application and when the GSM is considered the load is reduced a lot and a maximum value is imposed which is very less than the other two scenarios. Low quality speech application is considered an optimal load on the network is imposed and thus from the overall analysis it is clear that the quality of service requirements is enhanced with the GSM quality speech. 

Medium access delay in seconds 

Medium access delay is the delay occurred across the medium that connect the mobile nodes and the server and this value also imposed the required quality of service requirements for the voice application. When this situation is considered all the three scenarios considered are compared and the resultant graph is shown below

Medium access delay in seconds

When this graph is considered the medium access delay is more with the IP telephony. When the medium access delay is considered for the three scenarios the load is more with the IP telephony network and this due to the IP protocol implementation and this will reduce the quality of service on the network. 

A minimum load on the network is imposed due to the GSM network and for this implementation the overall quality of service requirements against the voice application and even in this case the low quality speech also imposed the optimal medium access load on the network. From this overall analysis it is clear that to improve the quality of service across the voice applications GSM level standards are required and this fact is proved in this context.

Network load 

Network load on the network indicates the overall load in terms of packets send and the congestion on the network and in this context the three scenarios are compared. First scenario holds the low quality speech, second scenario imposes the IP telephony and the third scenario indicates the GSM quality and the network load also plays an important role in estimating the quality of service across the voice applications and the resultant comparison graph is given below 

 Network load

From the above graph it is clear that the network load is more with the IP telephony when compared to the low quality speech and GSM quality speech. It is observed when the network load is considered more load on the network is imposed due to the IP telephony and this due to the fact the IP protocol is imposing more traffic on the network rather than the CBR traffic that was generated by the GSM and low quality speech.

GSM in general generated the CBR traffic where a constant traffic is directed towards the voice destination and thus the overall the network load on the network is reduced a lot. From this analysis it is clear that if GSM quality speech is used at the application level the impact on the quality of service requirements is directly adopted and it is increased a lot in this context. 

Retransmission attempts 

Retransmission attempts indicate the overall attempts made by the routing protocol to impose the quality of service requirements across the voice applications.  If the retransmission attempts are more then it indicates that the packets are lost across the network due to the voice application is more and also the nodes and the server are losing the packets and they are attempting a new route request as they lost the core destination route to reach the voice destination and the corresponding scenario comparison graph is shown below

 Retransmission attempts

From the above graph it is clear that the overall retransmission attempts is more with the IP telephony when compared with the other scenarios. It can be observed that the overall retransmission attempts made by the GSM quality is very less when compared to the IP telephony and the low quality speech and this indicates that the GSM is best suited to ensure the quality of service requirements and also the case of losing the packets is reduced a lot as the attempts made due to lose of the route is very less.

When the case with the IP telephony is considered the retransmission attempts are very more and a maximum value of 0.65 is recorded and this indicates that the quality of speech is suppressed and also the optimal conditions are violated. Thus from this overall analysis it is clear the total retransmission attempts are reduced due to the GSM quality aspects and thus the overall performance is improved at the same time against the quality of service requirements. 

Throughput 

Throughput indicate the quality of service requirements for the voice application in terms of overall network performance and in this context all the three scenarios considered are evaluated after the simulation for 5 minutes and the corresponding resultant graph is as shown below

 Throughput

From the above graph it is clear that the overall throughput is more with the IP telephony as the delay in the packet delivery is more. When the throughput is more the quality of service is reduced a lot and thus in this context the GSM quality voice application is imposing a very less throughput and thus the quality is improved in this context where the maximum throughput is due to the IP telephony as the IP protocol impose more traffic on the network and due to this the overall throughput is increased.

When the case with the low quality speech is considered an optimal throughput is occurred and due to this the overall voice performance is reduced a lot. From the overall analysis of the results it is clear that the quality of service across the voice applications can be improved with the GSM quality voice application.

Project Abstract on GSM Quality Speech

Traffic received in packets per second 

Traffic received in packets per second indicates the overall performance of the network in terms of number of packets delivered at the voice destination side. In general if more packets are delivered across the network then the overall quality of service requirements are enhanced and thus in this case the overall traffic received across the three scenarios is given in the below comparison graph

 Traffic received in packets per second

From this Project Abstract it is clear that the overall traffic received is more with the GSM and even the value is constant across the simulation. From the comparison of the three scenarios it is clear that the overall traffic received in packets per second is more with the GSM speech and also the value is constant when compared to all the other two scenarios. 

When the traffic received is more it indicates the overall performance of the network is increased in terms of quality delivery and thus from this comparison process it is clear even the traffic received is more with the low quality speech and this indicates that at the idle conditions the low quality speech is increased in terms of the traffic received and thus the overall quality of service is increased due to the traffic received. Even from this simulation process this indicates that the GSM quality speech is required to ensure the best quality of service requirements. 

Traffic sent in byte per second 

Traffic sent indicates the overall traffic sent by the nodes towards the destination and thus even the quality of service requirements purely depends on the traffic sent in bytes per second. As three applications are used in this process the overall traffic sent in bytes per second against the three applications is shown in the below screen

 Traffic sent in byte per second

The overall traffic sent across the network in bytes per second by the three scenarios is shown in the above screen. From the analysis if the average traffic sent it is clear that the overall traffic sent is more with the IP telephony and this is due to the reason that the telephony applications impose more traffic by the nodes and with this much traffic the overall traffic sent is increased and the nodes loose the core compatibility of against the quality of service requirements.

A low traffic is sent with the GSM quality speech and this indicates that the quality of service requirements across the voice application can be increased due to the GSM quality speech. The traffic sent by the low quality speech is also more when compared to GSM and thus even a constant traffic sent and thus the overall quality of service requirements is perfect for the GSM quality speech even in this case. 

Traffic sent in packets per second 

Traffic sent in packets per seconds indicates the total number of packets send across the network due to voice application impose across the network. In this context the three scenarios are compared for the traffic sent in packets per second and the resultant graph is shown as below

 Traffic sent in packets per second

From this Project Abstract it is clear that even the traffic sent in packets per second is more with the IP telephony when compared to low quality and GSM speech. When the traffic sent in packets per second is compared a more traffic is sent is with the IP telephony and thus the overall quality of service is reduced a lot and also the value has started after 3 minutes of simulation time.

When the case with the GSM is considered the overall traffic sent is very low and this indicates that the quality of service requirements are enhanced with the GSM speech and even in this case the GSM is proved to be the best quality of service requirements imposed for the voice applications.

Speech Quality Estimation in GSM Networks and MANET

Packet end to end delay 

End to end delay plays an important role in estimating the quality of service requirements and in this context the overall performance of the network also depends on the packet end to end delay. The actual packet end to end delay caused across the three scenarios is given in the comparison graph and from the actual ideal application that is suited for the quality of service requirements in terms of low packet end to end delay is estimated and the resultant comparison graph is as shown below

  Packet end to end delay

This graph indicates that even the packet end to end delay is more with the IP telephony and this value is more than the other two application types. It can be understood that the packet end to end delay is very less with the GSM quality speech and it is almost zero where the packet end to end delay is more with the low quality speech when compared with GSM and very less when compared with IP telephony.

In general when there is low packet end to end delay then the optimal performance of the network against the quality of service requirements for a voice application can be ensured and the same is proved in this comparison. When all these three scenarios are compared now the quality of service requirements with the GSM speech is at the optimal level and thus always the GSM attributes are perfect at the quality of service requirements. 

Traffic received bytes per second 

Traffic received across the network indicates the overall traffic received at the destination side for the voice server and in this process all the three scenarios are considered and compared at the traffic level and the comparison graph is as shown below. In general the traffic received should be very less to ensure the optimal quality of service requirements and thus the overall traffic received at the voice destination by the three scenarios is as given below

 Traffic received bytes per second

The average traffic received at the voice destination is shown in the above graph. It is clear that the overall traffic received at the voice destination is more with the GSM quality speech when compared to the other two scenarios. A low traffic is received with the IP telephony and this indicates that ample number of CBR traffic packets are not received at the destination side and thus the quality of service is depressed a lot with the IP telephony application and when the case with the low quality speech is considered an optimal traffic received and even this value is less than the GSM quality speech.

From this overall analysis it can be concluded that the quality of service requirements can be enhanced with the traffic received and thus in this case it is understood that GSM quality voice applications are best suited to deliver more traffic and also ensure the maximum quality across the network. 

MOS value and Packet delay variation in MANET

MOS value 

MOS value will be in a range from 1 to 5, where 1 indicates the bad quality, 2 indicates the poor quality, 3 indicates the fair value, 4 indicates the good quality and 5 indicates the excellent quality and in this context the actual MOS value recorded for the three scenarios is given in this section. The actual MOS values recorded are compared for all the three scenarios and presented in the below comparison graph as shown below

From this graph it is clear the MOS value recorded for the GSM quality speech is more when compared to the other scenarios. It is observed that a value of 3.6 is recorded for GSM quality and with this range it is clear that a good quality speech is incurred against the quality of service for voice application where the MOS value for low quality speech is only 2.5 which indicates that a fair quality is incurred with the voice and the MOS value recorded by IP telephony is around 3 and even in this case a fair quality speech is delivered and it can also observed that the MOS value for IP telephony and low quality speech are not constant and they were initially high and later at the end of the simulation their quality has dropped to a bad range.

This indicates that the quality of service requirements for IP telephony and low quality speech are depressed when the communication is proceeding and but with the case of GSM quality speech a constant MOS value is recorded and even this value indicates that a good quality of service requirements are imposed by GSM on the overall network performance. From this analysis it can be concluded that when the MOS value is more the overall quality of service is improved across the voice applications. 

Packet delay variation 

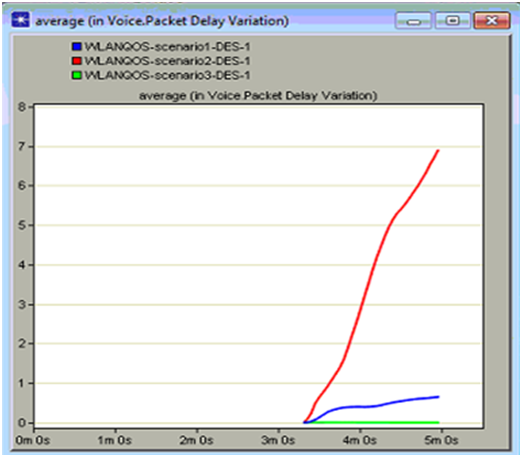
Packet delay variation indicates the actual delay caused due to voice application on the network and as three types of voice applications are used in this context the overall packet delay variation incurred by these three voice profiles is given in the below graph. If the packet delay variation is more then it indicates that the overall performance of the network is degraded a lot and due to this the quality of service is reduced and in this context the actual packet delay variation shown by these three applications is shown in the below comparison graph 

 Packet delay variation

From the above graph it is clear the overall packet delay variation is more with the IP telephony when compared to the other two scenarios. In general the IP telephony need more attention towards the CBR traffic and due to the CBR traffic the packet delay variation is increases a lot and thus the overall quality of service offerings is reduced a lot when compared to the other voice applications.

The packet delay variation occurred with the GSM quality speech is very less and is almost zero and this indicates the packets are transferred with an optimal rate without any delay across the network and thus the quality of service is increased a lot in this context. The packet delay variation occurred with the low quality speech is also less when compared to the IP telephony and this indicates that the overall noise across the speech is suppressed at this level and thus the packets are delivered at an optimal rate and thus the overall analysis it is clear that the quality of service can be increased with a low packet delay variation and again this can be achieved with the GSM quality voice application to improve the quality of service.

Voice metrics and Jitter in wireless LAN

Results and Analysis

Introduction

Simulation methods followed to create the required scenarios is explained in the previous chapter and after running the simulation for 5 minutes the respective results are achieved and they are given in this section.  As mentioned three scenarios are created and the results of these three scenarios are compared against the DES metrics used are given in this chapter along the required quality of service evaluation. As three different types of voice applications are used in this project their performance in terms of quality of service is understood based on the results achieved and they are explained in detail in this chapter and the resultant graphs are also shown as below 

Voice metrics

As the main aim of this QOS metrics for voice schemes across wireless LAN  project is to evaluate the quality of service requirements for the voice applications across the MANET, few voice metrics as discussed in the previous chapter are compared for all the three scenarios designed in this section and they are given as below 

Jitter

In general jitter indicates the packet delay variation and the packet delivery efficiency across the network and in this process the results from all the three scenarios are considered. First scenario uses the low quality speech, second scenario uses the IP telephony, and third scenario issues the GSM quality voice across the network and the quality of service metrics are estimated and jitter is one among them. In general low jitter indicates a good quality of service metrics and in this context the actual value is estimated as per the comparison graphs as shown below.

 Jitter

It is observed that the jitter imposed by the IP telephony is more when compared to the other scenarios and even the value is not constant throughout the simulation and there is lot of variations which indicates that there is lot of packet loss with the IP telephony. The overall performance of the GSM quality voice is better when compared to the other scenarios as the speech is suppressed and in this context the overall performance of the application has increased due this low jitter value and thus the quality of service is enhanced is many aspects.

The performance of low quality speech voice application is better than the IP telephony as the quality consumed by a simple speech application is very less and thus the noise across the speech is suppressed at a constant rate and thus the overall quality of service is enhanced. This value is more than the GSM quality as the propagation aspects followed across the GSM are inbuilt with the default quality metrics and thus the overall jitter is very less and constant throughout the simulation.

From this analysis it is clear that the overall quality of service can be improved with the low jitter value and in this context the speech noise depressed and thus GSM has shown a constant jitter and this indicates that the packet delay variation is constant and also the packet delivery is at the idle conditions and thus the overall quality of service is improved.

Settings for Mobile Nodes Mobility Configuration and Wireless LAN server

Setting the application configuration 

Defining the application definitions is the main step in this simulation as the required voice applications are created and the required Quality of service settings are done in this section. As mentioned in the above section, application configuration object is used and the required attributes for the application config are edited to set the application definitions. Following steps need to be followed in creating in the application definitions 

  • Edit the attributes of the application configuration by right clicking on the node
  • Go to the application definitions tab as shown in the below screen
  • Enter the number of rows as 1 such that in this scenario a single application is created
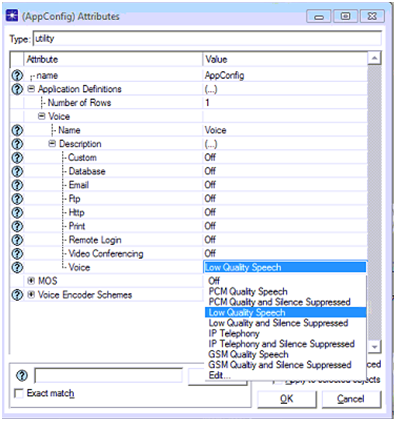
  • Name the application as per the requirements and expand the application description tab to choose the desired application and the corresponding screen is as shown below 
Setting the application configuration

From this screen it can be observed that a low quality speech application is chose against the voice application and thus it indicates that this application supports a low quality speech in terms of quality of service requirements. This can be considered as the main step in defining the applications and in general there are different options available here and rest of the application types is chosen in the next scenarios. Now the Ok button is clicked to apply the low quality speech application to this scenario and the settings to be done for profile definitions are explained as below 

Settings done for profile definition 

There should be a profile definition for the application created and in this process a single profile is created for the low quality speech application created in the previous step and the settings need to be done in this context are given below 

  • Edit the profile configuration option by right clicking on the profile configuration object
  • Give the number of rows as 1 for the  profile configuration and name the profile as voice
  • Choose Voice application as the desired application to be supported against the profile definitions and the corresponding screen is as shown below
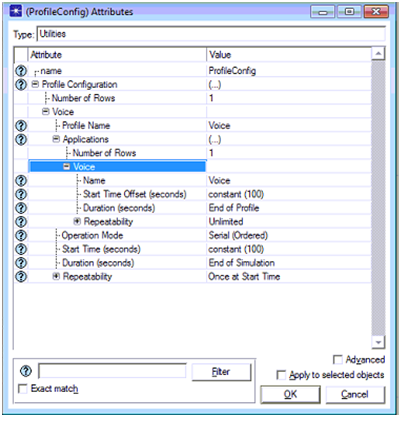
Settings done for profile definition

From this screenshot it is clear that the number of rows is given as 1 and voice profile is chosen as the desired profile.  Voice application is chosen for the profile definition and the a constant value of 100 seconds is given for start time offset, end of profile is chosen as the duration of the profile, a constant value of 100 is chosen for start time and again the duration of the profile is set to end of simulation as shown in the above screen. Once the profile settings are done then these profile settings and the application settings need to be addressed to all the mobile nodes and the wireless LAN server and the actual process adopted in this simulation are given as below 

Settings done for mobile nodes and wireless LAN server 

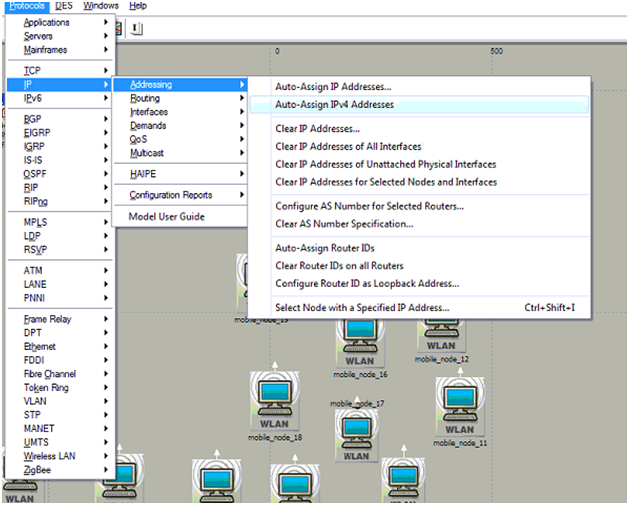
A simple wireless LAN based MANET is created in this simulation and for this purpose all the WLAN workstations and server are edited for settings the attributes and in this context the process followed is explained in this section. First step in settings the attributes for the mobile nodes and the wireless LAN server is assigning the IP addresses for all the nodes and the following steps need to be followed to assign the IP addresses

  • All the mobile nodes and the server should be selected from the simulation network
  • Move the control towards the protocols menu and then choose the IP option
  • There the users can find an option like addressing and from there choose the option Auto assign IPV4 addressing to assign the IPV4 addresses to all the nodes on the network and the corresponding screen is as shown below
Settings done for mobile nodes and wireless LAN server

With this step all the nodes and the wireless LAN server are assigned with the IPV4 addresses and thus all the nodes are identified with a unique IP address for the routing process. The next step in the simulation is to assign the desired routing protocol to all the nodes and the server and the steps that should be followed are as given below

  • All the nodes and the server should be selected and then choose any of the node from the simulation network
  • Ad hoc routing parameters should be edited to set the required routing protocol as AODV and the corresponding screenshot is as shown below 
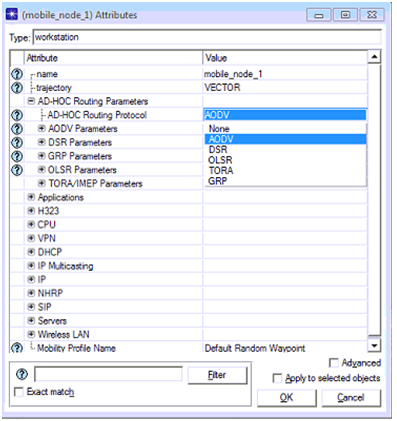
Settings done for mobile nodes and wireless LAN server1

It is clear that AODV is used as the routing protocol and thus now all the nodes and the wireless LAN server support the AODV routing parameters for the basic communication aspects. Now the AODV routing protocol plays the key role in delivering the voice packets to the destination.  When the routing protocol is set to the desired nodes and the server, the application and profile settings need to be assigned to the nodes and the corresponding process followed is as explained below 

  • Select all option is chosen to select all the mobile nodes on the simulation network
  • Any one of the mobile nodes from the selected nodes is chosen and edited for all the application attributed by right clicking on the selected node and the corresponding process is shown as below 
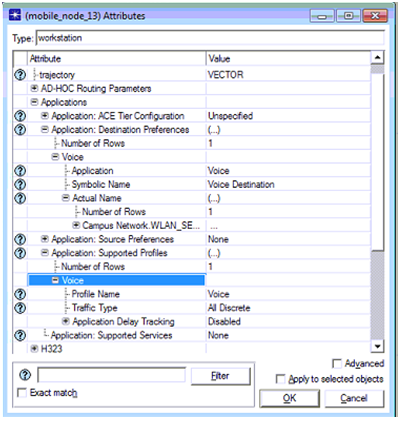
Settings done for mobile nodes and wireless LAN server2

The application attributes of the selected node are shown above and from this it is clear that the application destination preferences is assigned with one row and voice is given as the desired the application destination and the voice destination is selected as the symbolic name.  Application supported profile is set to one row and the profile name is set as voice and thus all the nodes across the network will support the voice destination and voice profile across the network by choosing apply to selected objects is checked for the settings. Similar procedure is followed for the wireless LAN server and the corresponding screenshot is given below.
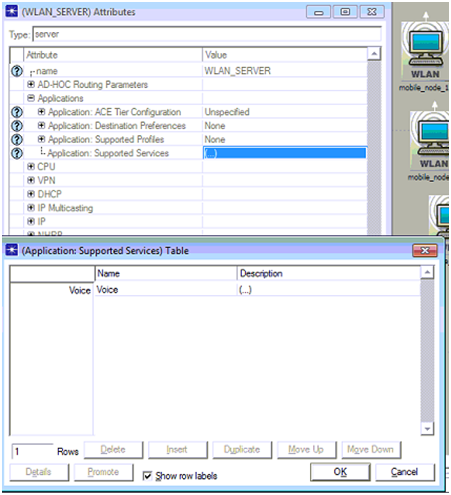
Settings done for mobile nodes and wireless LAN server3

A single row is added to the application supported services table and voice is selected as the desired option and the description is given as supported and with this the server now will support the voice profile and as mentioned a low quality speech is used for this simulation process and thus all the mobile nodes and server will now support the low quality speech across the network. This process can be done in another way known as deployment procedure, where this option is available with the applications menu of protocols and with this the all the nodes and server are dragged against the source and destination respectively. 

Setting the mobility configuration 

Mobile nodes are used in this simulation process and these nodes required some mobility profiles such that their key attributes like speed, destination, source and direction are defined at this level. To define the mobility profiles in general the mobility configuration object is used and edited to set the required setup for mobility. There are different mobility options available to the users and in this scenario a default random waypoint mobility model is used and the corresponding screen is as given below
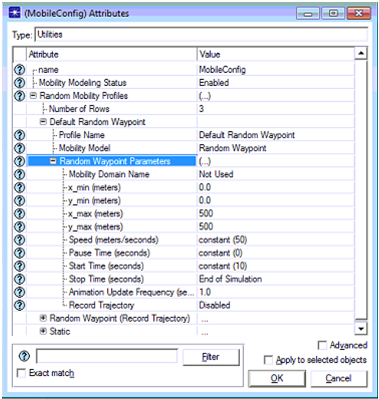
Setting the mobility configuration

Default random waypoint mobility model is used and the mobility model used here is random waypoint and the mobility modeling status is set to enable. Key aspects of the mobility like speed is set to a value of constant of 50 meters per sec, pause time is set to 0 seconds, start time is set to a constant value of 10 seconds and stop time is set to end of simulation. When all the attributes are set for the mobile configuration these profiles should be applied to all the mobile nodes and this can be set at the topology menu level. Set mobility profile is used for this purposed and with this all the mobile nodes are assigned with the default random waypoint mobility model and now they can move with the defined speed and pause time as described above. 

Settings the DES statistics 

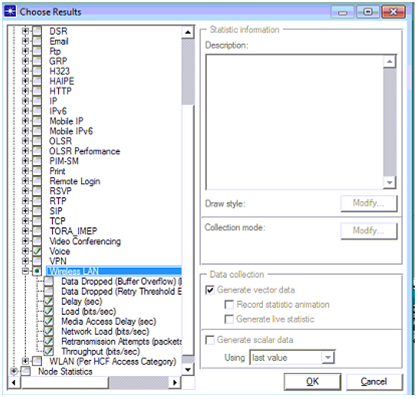
DES statistics are used to estimate the performance of the network and they can be set across the OPNET simulation at three different levels like global level, node level and link level. In this simulation global level performance metrics are used and these metrics are set against the overall performance of the network. As voice is used as the application and low quality speech is used for the voice application the global level voice metrics and the wireless LAN level metrics are used to estimate the performance and quality of service level attributes are also set in this process and the procedure followed is given below 

  • Choose Individual DES statistics option is selected in the at the simulation network level by right clicking on the workspace of the simulation
  • Global level attributes are set in this process and the related graphs are as shown below

Choose Individual DES statistics option is chosen and then the corresponding screen is as shown below
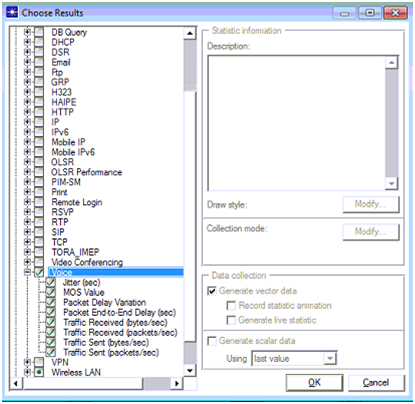
Settings the DES statistics

Few Voice metrics are used across the performance evaluation and they are listed as below 

  • Jitter in seconds
  • MOS value
  • Packet delay variation
  • Packet end to end delay in seconds
  • Traffic received in bytes per seconds
  • Traffic received in packets per seconds
  • Traffic sent in bytes per second
  • Traffic sent in packets per second 

Settings the DES statistics1

Above screen shows the wireless LAN parameters used and they are listed as below 

  • Delay in seconds
  • Load in bits per second
  • Medium access delay in seconds
  • Network load in bits per seconds
  • Retransmission attempts in packets
  • Throughput in bits per seconds 

Once all the attributes are set the required simulation run for 5 minutes to view the results and with this step the simulation of first scenario is done and the actual quality of service level voice applications used for the second and third scenario are as given below 

Simulation procedure for scenario two 

First scenario is duplicated from the scenarios menu and few changes are done to the voice application and they are shown in the below screen
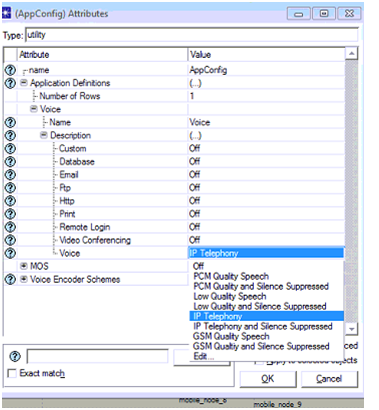
Simulation procedure for scenario two


Application configuration object is edited and the IP telephony is chosen as the required voice application and thus the quality of service aspects are changed to the IP telephony level voice application as shown in the above screen. 

Simulation procedure for scenario three 

Second scenario is duplicated from the scenarios menu and the actual application used against the voice is shown in the below screen
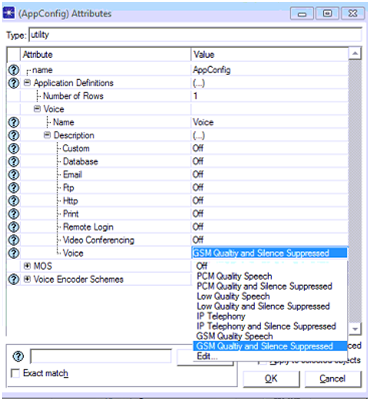
Simulation procedure for scenario three


GSM quality and silence suppressed voice application is used at the application configuration object and thus the quality of service is set to the GSM level as shown in the above screen. With this step all the three scenarios are created and next step is to run the simulation and the corresponding process is as shown below 

Scenario management 

Once all the three scenarios are created and saved they can be run using the manage scenarios option from the scenarios menu and the corresponding screen is as shown below
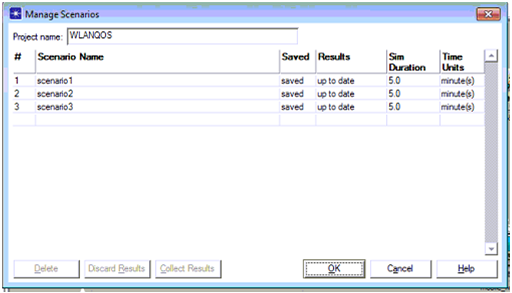
Scenario management

A table is opened at the user interface level and from this table it is clear that all the three scenarios are listed and the simulation duration is also set for 5 minutes and once the OK button is clicked all the three scenarios are run and then the next step is to view the comparison results and this can be done as shown below
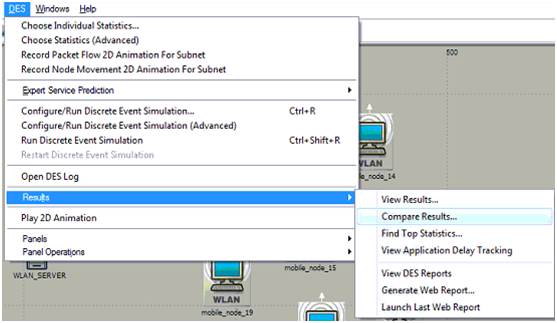
Scenario management1

 Above screen shows the process to be implemented to compare the results and with this the comparison graphs can be viewed and they are shown in the next chapter.

Wireless LAN based MANET White Paper

Introduction

Simulation methodology implemented across this project is explained in this chapter. The main aim of the Wireless LAN based MANET project is to evaluate the Quality of service requirements for the voice schemes across the wireless LAN; in this project a simple wireless LAN based mobile ad hoc network is created. Few wireless LAN workstations and wireless LAN server are considered across the MANET and these nodes support different voice schemes and three scenarios are created in this context to support three different voice schemes and the process followed to create these three scenarios is explained in this chapter. Step by step implementation methodology is discussed in detailed in this chapter with reference the key attributes edited for the wireless LAN nodes and all those attributes are also discussed in this chapter. 

Scenario 1: Simulation procedure 

In this section the simulation procedure followed to create the scenario 1 is discussed and in general simulation of a scenario holds many aspects like creating the core network, defining the attributes for the nodes, editing the application and profile configurations, defining the mobility profiles and settings the DES metrics and all these aspects are explained in detail in chapter along with the step by step procedure followed as below.

Process to create the basic network 

Creating the core network is the first step across any simulation process and as discussed a simple wireless LAN based MANET is used as the basic network for this scenario. To create a MANET, OPNET modeler provides a feasibility to download the MANET model from the model dependencies and this model and the corresponding objects can be used to create the MANET. Following steps are useful in understanding the basic principles to be followed in creating the MANET from OPNET modeler tool 

  • Start the OPNET modeler and accept the license agreement before creating the actual required network
  • Go to file menu and chose the option New to create a new project and even the users are provided with an option to open the existing projects as well
  • By default a new project and new scenario options are shown to the users and there the desired project name and scenario name are given to save the project against the project name given
  • Create an empty scenario option is chosen to create the user define scenario, where the users are provided with an option to choose the default scenario configurations for the usage
  • Now the required topology is chosen where the users are provided with an option like campus, office, world and maps and in this simulation campus is chosen as the required topology
  • Size of the campus is also chosen where it is given as 1000 X 1000 square meters and thus now a campus of this size is created
  • Different network models are provided across OPNET modeler and in this simulation MANET is chosen by checking the option Yes against the No option and with this step MANET objects are applied to the simulation
  • A simple object palette is created and from here the required objects can be used in creating the basic network
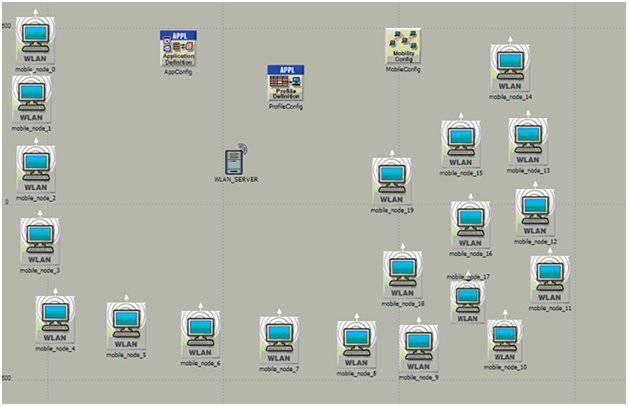
  • As discussed a wireless LAN based MANET is created, 20 mobile WLAN workstations are dragged from the object palette and now these workstations acts as the mobile nodes
  • A single wireless LAN fixed server is used as the destination server for all the mobile nodes
  • To define the required voice application settings an application configuration object is used by dragging from the object palette
  • To define the required voice profiles against the voice applications, a profile configuration object is used by dragging from the object palette
  • To define the mobility to all the mobile nodes across MANET, mobile configuration object is used by dragging it from the object palette and once all these objects are used the corresponding network is as shown below in the screenshot.

 Process to create the basic network

From this screen it is clear that 20 mobile nodes, a single wireless LAN server, application configuration, mobile configuration and profile configuration are used for the scenario  1 and with the creation of the basic network is completed and now the settings to be done for this network are explained below

Requirements of QoS for voice against IP

Requirements of QoS for voice against IP:

 In the latest research studies the main concentration is applied on the study of “Quality of service” for the IP networks. As a result to this the competition for the development of Qos solutions is increased. Estimating and developing the QoS solutions for IP networks particular in the situations of various kinds of IP traffic types that ate available is not the MSF intension.

The main intension of MSF in the present situation is to resolve the issues related to encouraging of voice services across the IP networks. Therefore the characteristics of the “toll quality voice services” must be considered significantly by regarding the Qos mechanisms of IP networks. The following are the performances that are needed for the “toll quality voice service”.

  • When once the call control accepts a call and when resources that are allocated to the call must be carried by the voice quality that is needed for the completion.
  • As far as possible physically, the calls established must be secured against the disturbances caused by the network. And this causes to some allegations and one among those is when it is allocated with the IP network that is connectionless, that is due to the over loads that are caused suddenly by the traffic’s re-routing the constant calls are affected adversely by the loads by various parts of the network.
  • The networks should have the capacity of encouraging the attempts of call setups that are of very high level. Several call attempts of busy hours are supported by the narrow band exchanges that are exist and the volumes that are comparable must be supported by the VOIP network.
  • When the heavy load is focused. The calls that can’t be continued must be avoided and during this process the call which will carry the capacity must not be degraded.  

                    basic service set and extended service set

Figure:  basic service set and extended service set