A frequency based approach to intrusion detection User manual

User manual 

Detailed simulation steps followed in this frequency based approach to intrusion detection project is given with the required screenshots is given in this section

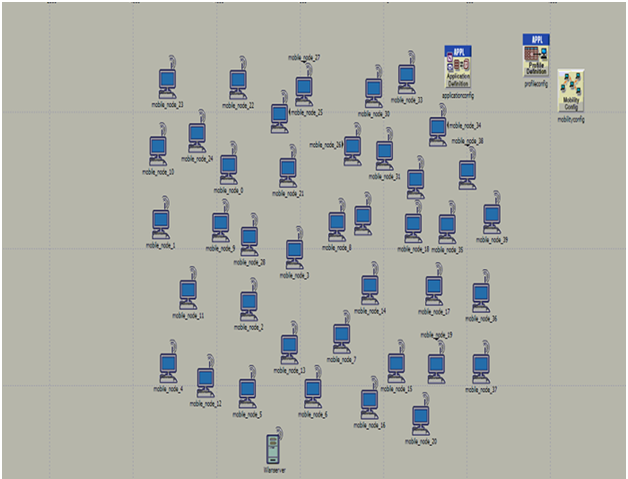
 network with 30 mobile nodes

Above screen shows the basic network with 30 mobile nodes, application configuration, profile configuration and the wireless LAN server. All these nodes are dragged from the object palette and this palette is shown in the simulation procedure chapter.

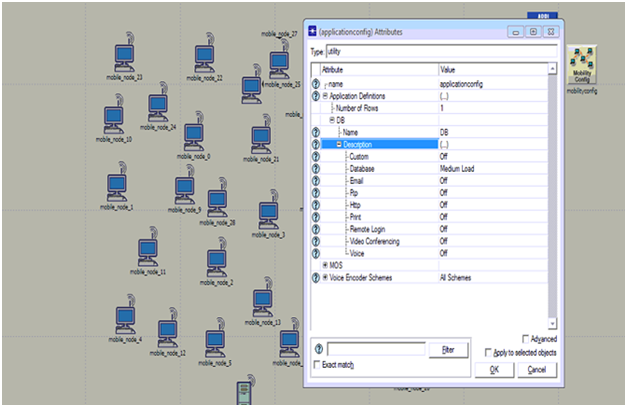
 application configuration

Above screen shows the application configuration and from this it is clear that DB is used as the application and it is set by medium load across the database option.

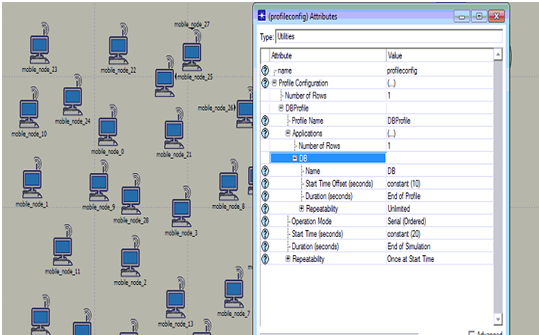
profile configuration 

Procedure to setup the profile configuration is shown in the above screen. From this it is clear that DB application is used to set the profile and the start time and duration are set in the profile settings as shown in the above screen

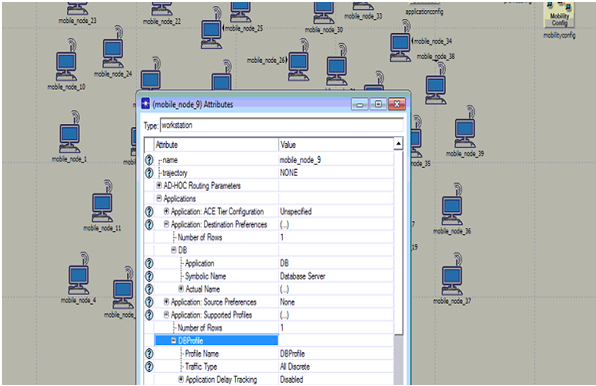
 Application settings to the nodes

Application settings to the nodes are shown in the above screen. From this screen it is clear that application destination preferences and the application supported profiles are set against the database application created.

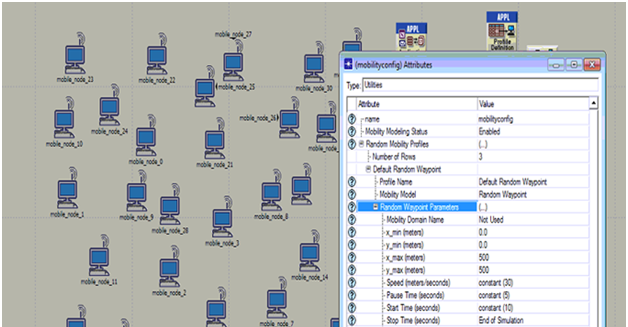
 Mobility configuration is set and the process

Mobility configuration is set and the process is shown in the above screen. From this screen it is clear that default random waypoint is used as the required mobility model and few aspects like speed, pause time, start time and stop time are set as shown in the above screen.

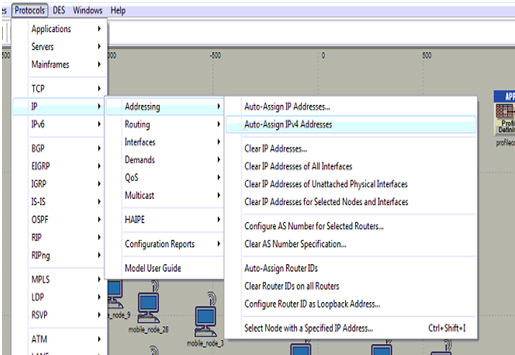
 Assigning the IP addresses to all the mobile nodes

Assigning the IP addresses to all the mobile nodes is shown in the above screen and it is clear from the above screen that IPV4 address are added to all the nodes and the wireless LAN server.

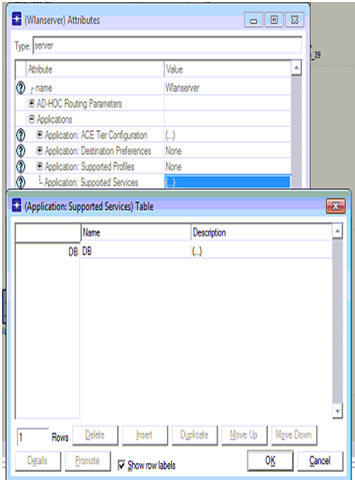
 Database is set as the required application

Database is set as the required application to be supported across the server and the corresponding screen is as shown below

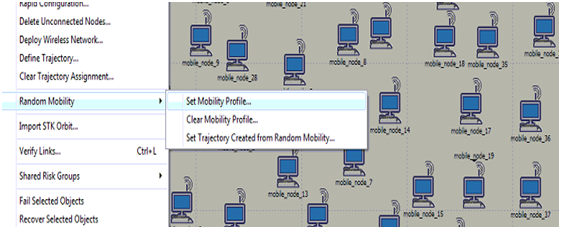
Procedure to set the mobility to all the mobile nodes 

Procedure to set the mobility to all the mobile nodes against the mobile configuration is shown in the above screen and by this the default random waypoint is set to all the nodes across the network.

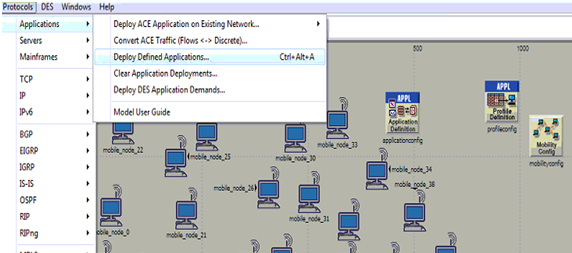
 Process to deploy the application

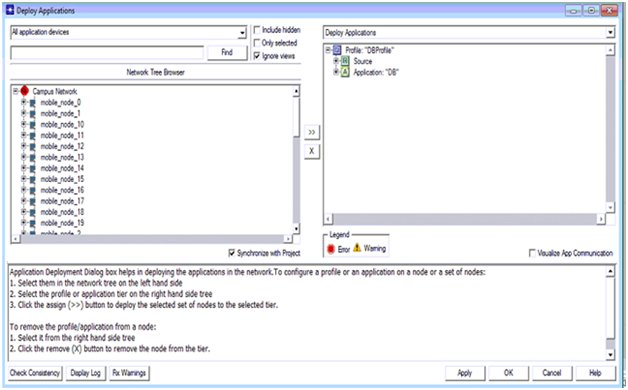
Process to deploy the application is shown in the above screen and this option is available from the protocols menu and applications sub menu and the corresponding screen is as shown below

 corresponding deployment screen

Once the deploy option is selected the corresponding deployment screen is as shown above. From this screen it is clear that all the mobile nodes are shown on the left side and the corresponding source and destination are defined at the right side. Arrow mark available on middle of the window can be used to deploy the nodes and server to the source and destination respectively.

 applications are deployed the next step

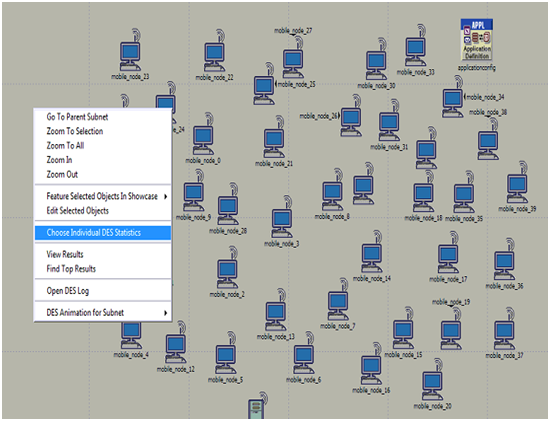
Once the applications are deployed the next step is to choose the individual DES statistics and the corresponding screen is as shown above. DES statistics are used to set the performance metrics and the corresponding screen is as shown below

 DSR parameters

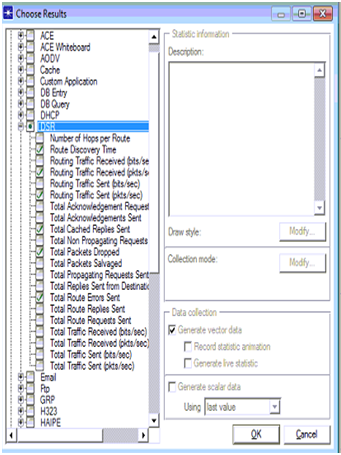
DSR parameters are set across the performance evaluation process and the actual parameters chosen from the global statistics are shown in the above screen

 actual attributes

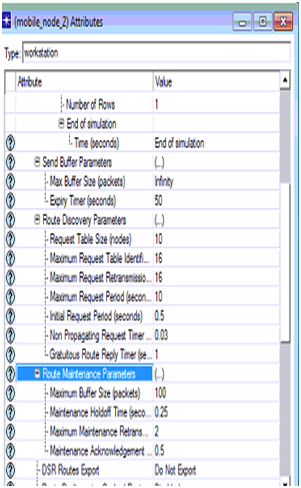
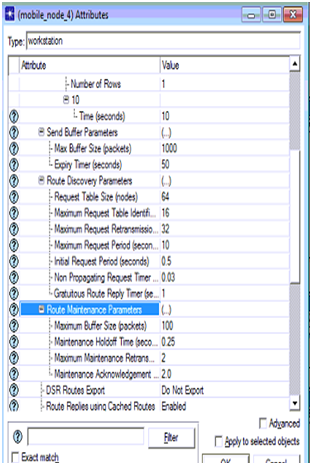
The actual attributes edited for the DSR routing protocol in the second scenario are shown in the above screen and thus the node 2 acts as the intruder node.

 DSR parameters set for the node 4

DSR parameters set for the node 4 is shown in the above screen

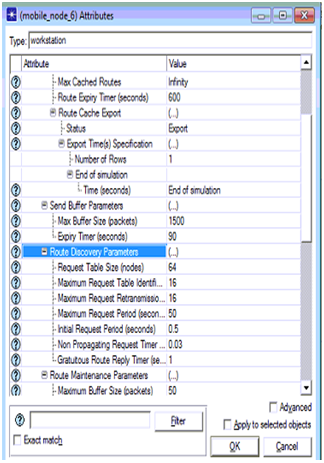
 DSR parameters set for the node 6

DSR parameters set for the node 6 in the third scenario are shown in the above screen and thus there are three attack nodes across the network.

Intruder Detection Techniques for Providing Security to the Networks

Providing security to the networks is the main task for the administrators and they are struggling a lot to ensure the maximum security to the network in all the possible aspects. Among lot of security threats among the networks and applications intruders has a significant role to play and in this context there are many intruder detection techniques and they are discussed in the literature review section of this project. Most of the intruder detection techniques concentrate on the intruder traffic that was generated across the network and there is no ample work done towards the intruder frequency and the corresponding affect on the network.

In this context a frequency based intruder detection process is identified in this project and OPNET modeler is used as the tool to simulate the proposed design as discussed in the design chapter. Scenarios are required to estimate the performance of the proposed design and thus three scenarios are created, where the first scenario has normal working network conditions with no intruder attack nodes, second scenario has two intruder node attacks and the third scenario has three attack nodes. DSR is the routing protocol used in the simulation process and few metrics of DSR are used to estimate the behavior of the intruders by increasing their frequency and the overall result analysis is done and is as given below. 

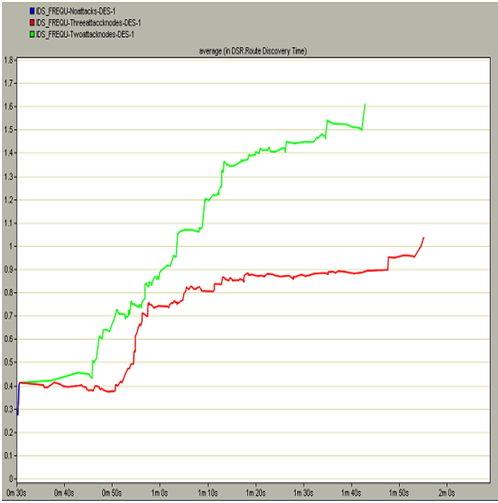
It is observed that the route discovery time taken by the first scenario is negligible when compared to the other two scenarios. The route discovery time taken by the two node attacks scenario is very high and almost the maximum taken in this context is around 1.6 seconds and this indicates that, there is lot of packet loss in this situation. It is also observed that the route discovery time taken by the three node attacks scenario is also more when compared with the first scenario and less than the two node attacks scenario and this is due to the reason that, when the third node starts working all the required damage to the route is done and thus no more route discovery options are executed and thus this value is less than the second scenario.

This indicates that if there are some intruder attacks on the nodes, automatically the route discovery time is increased and finally the actual route is lost and thus lot time is consumed to identify the desired route for the communication and in this manner the frequency of the intruders will affect the overall performance of the network and they can be eliminated by comparing the route discovery time metrics. 

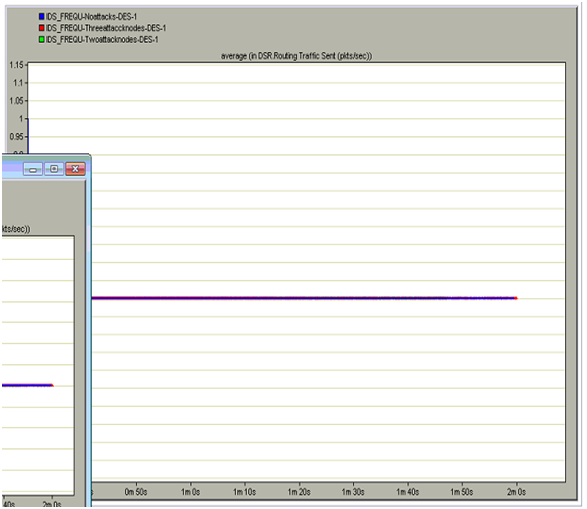
The total routing traffic sent across the network is more with the three intruder attack nodes as in general the intruders will more routing traffic across the network and with this the overall performance of the network is highly impacted due to this routing traffic on the network. It is also observed that an equal amount of traffic is sent by the normal scenario but it is less than the two attack nodes scenario as the two intruder attack nodes impose more routing traffic and due to the three attack nodes traffic is not sent across the network and from this it can be understood that the routing process is completely halted due to the three attack nodes. Thus from this analysis it can be concluded that if there are more frequency of the intruder attack nodes more routing traffic is sent across the network and the overall performance of the network is affected a lot and thus based on this traffic sent the actual intruder actions can be detected. .

Due to the impact of the intruder actions on the network more traffic is relieved at the destination and the server will received more intruder traffic when compared to the normal traffic. When the traffic received is more the server will discard all the routing packets from the non attack nodes and thus the communication is completely violated in this context. It can also be discovered that there is no traffic received from the two node attacks as the traffic sending and traffic received is complete halted and thus there is no traffic relieved in this context. From this analysis it is clear that if the traffic received is more than the intruder actions are more and in this way based on the intruder actions can be detected.

At the beginning of the simulation there are some cache replied due to the normal scenarios and later the total number of cache replies sent by the second scenario where there are two attack nodes and the cache replies sent by the third scenario where there are three attack nodes is more and these replies are sent till end of the communication process. In general where there are more cache replies across the network it indicates that there is lot of intruder traffic on the network and even if the frequency of the intruder attacked nodes increases the total number of cache replies are increases and thus there is lot of congestion across the network and also the total number of packet drops are increase exponentially.

Thus when all the three scenarios are compared, more cache replies are sent when there are three attack nodes and thus it can be concluded that based on these number of cache replies the overall intruders on the network can be detected and prevented further. Initially there is some packet drop across the network even in the case of no attack nodes and this drop is due to the normal traffic conditions and the kind of the application is used across the network to generate the required traffic and in general the packet drop should be limited and the same proved across the simulation. When the three intruder attack nodes scenario is considered the packet drop is more as the intruder packets are more and due to these packets the actual packets are lost and in this process all the nodes will lose the actual data packets and in this context the total number of packets dropped is increased and this drop will continue till end of the simulation.

There is no packet drop with two attack nodes and this is mainly due to the reason that when all the important data packets are lost by the three intruders attack nodes, there is no scope to drop the data packets and thus the packet drop is not recorded in this process. The total route errors sent with the no attacks scenario us very less when compared to the three attack nodes scenario and this is due to the reason that when there are some intruder attacks on the network, more route discovery attributes are set and due to this the average number of router errors are more and they are sent across the network.

When the server receives the route errors it will start processing these requests and in this process will keep the normal nodes on hold for long time and due to this even the packet drop is also increased a lot. It can be observed from the comparison result that when there are two attack nodes there are no route errors across the network and from this it can be concluded that the routing process is completely stopped when the three attack nodes has manipulated the traffic and there is no traffic to be processed with two attack nodes. 

Future work

Future work to be done to improve the research and simulation in few aspects is given below

  • DSR is used as the routing protocol and in future the scope of the simulation can be increased at different routing protocols level and they can be compared and analyzed to estimate the best routing protocol for intruder detection
  • Different intruder actions can be introduced at the global level in future to improve the scope of the application
  • In future more number of attack nodes can be created and the frequency based intruder detection can be analyzed in a better manner.
  • In future NS2 simulation can be done to execute the DFT based equations for intruder detection, where are currently only an user interface level modifications are done to the routing protocol parameters and thus it can be considered as the limitation of this simulation

Dynamic Source Routing (DSR) Protocol Project Report

 Results are obtained after running the simulation for 5 minutes and the actual methodology to design the simulation and the simulation procedure followed is explained in the previous chapters. Three scenarios are created in this simulation procedure and the fist scenario has normal configuration aspects, second scenario has two more attack nodes where the parameters of the routing protocols are changes. Now the third scenario on total has three attack nodes and the behavior of the attack nodes is varied when compared to the non attack nodes by changing the attributes of the routing protocol. Dynamic Source Routing (DSR) routing protocol is used as the protocol to route the packets in this simulation process and thus all the required scenarios are compared to estimate the performance of attack nodes and non attack nodes. When these scenarios are compared few graphs are achieved and they are explained, reviewed and given below 

DSR metrics for three scenarios 

DSR is used as the routing protocol and few metrics are set in this process and the comparison graphs of these metrics against the three scenarios are presented across this section. As given in the simulation procedure chapter DSR metrics like discovery time, routing traffic received, routing traffic sent, total cache replies sent, total packets dropped and total route errors sent are chosen to estimate the performance of the network against the intruder attacks. Now the respective comparison graphs obtained after running the simulation for 5 minutes for all the three scenarios is given in this section. 

DSR route discovery time 

Route discovery time indicates the actual time to discover the required to reach the destination and in general this value should be less enough to ensure the fast communication across the nodes and server. If the route discovery time is more it implies that there is more packet drop across the network and thus the mobile nodes are sending the more route requests and the route is unavailable to be discovered. The actual route discovery time incurred in this simulation by the three scenarios is shown in the below screen

 DSR route discovery time

The average route discovery time incurred across the three scenarios is shown in the above graph. There are three different colors across the graph, where the blue color curve indicates the normal conditions where there are no attack nodes, green color indicates the scenario with two node attacks and the red color indicates that there are three attack nodes. When these curves are compared it is observed that the route discovery time taken by the first scenario is negligible when compared to the other two scenarios. The route discovery time taken by the two node attacks scenario is very high and almost the maximum taken in this context is around 1.6 seconds and this indicates that, there is lot of packet loss in this situation. It is also observed that the route discovery time taken by the three node attacks scenario is also more when compared with the first scenario and less than the two node attacks scenario and this is due to the reason that, when the third node starts working all the required damage to the route is done and thus no more route discovery options are executed and thus this value is less than the second scenario. This indicates that if there are some intruder attacks on the nodes, automatically the route discovery time is increased and finally the actual route is lost and thus lot time is consumed to identify the desired route for the communication and in this manner the frequency of the intruders will affect the overall performance of the network and they can be eliminated by comparing the route discovery time metrics. 

DSR traffic routing sent in packets per second 

DSR routing traffic sent plays an important role in estimating the performance of the network and in general this should be less enough across the network for the optimal performance of the network. If the routing traffic is more then automatically it indicates that the intruders are sending more traffic across the network and thus they are making the neighboring nodes and the server busy in processing the intruder traffic. If the server and nodes are busy in processing the intruder traffic they will lose the actual traffic sent and thus intruders will totally impact the performance of the network on a whole. In this process the actual routing traffic sent by all the three scenarios is shown as below 

 DSR traffic routing sent in packets per second

From the above comparison graph it can be observed that more traffic is sent across the three node attacks scenario when compared to the first scenario and the two node attacks scenario. From the graph it is clear that, the total routing traffic sent across the network is more with the three intruder attack nodes as in general the intruders will more routing traffic across the network and with this the overall performance of the network is highly impacted due to this routing traffic on the network. It is also observed that an equal amount of traffic is sent by the normal scenario but it is less than the two attack nodes scenario as the two intruder attack nodes impose more routing traffic and due to the three attack nodes traffic is not sent across the network and from this it can be understood that the routing process is completely halted due to the three attack nodes. Thus from this analysis it can be concluded that if there are more frequency of the intruder attack nodes more routing traffic is sent across the network and the overall performance of the network is affected a lot and thus based on this traffic sent the actual intruder actions can be detected.

DSR routing traffic received in packets per second 

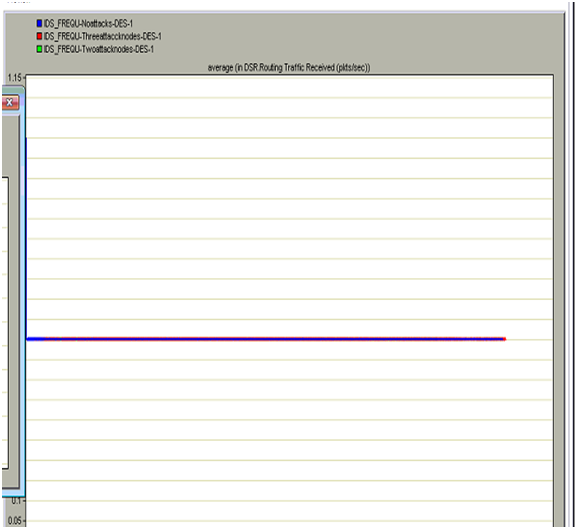
The actual DSR routing traffic received across the network due across the three scenarios is given in this section.  If the routing traffic received is more it indicates that the intruder actions are imposing more traffic across the network and also this traffic received imposes the working conditions of the network to be deactivate. The overall routing traffic received across the network will be more when the frequency of the intruder attack nodes is more the traffic is more across the network. 

 DSR routing traffic received in packets per second

From the above graph it is clear that the overall traffic received across the network due to the three attacks is more when compared to the first scenario and two attack nodes. Due to the impact of the intruder actions on the network more traffic is relieved at the destination and the server will received more intruder traffic when compared to the normal traffic. When the traffic received is more the server will discard all the routing packets from the non attack nodes and thus the communication is completely violated in this context. It can also be discovered that there is no traffic received from the two node attacks as the traffic sending and traffic received is complete halted and thus there is no traffic relieved in this context. From this analysis it is clear that if the traffic received is more than the intruder actions are more and in this way based on the intruder actions can be detected. 

DSR total cache replies sent 

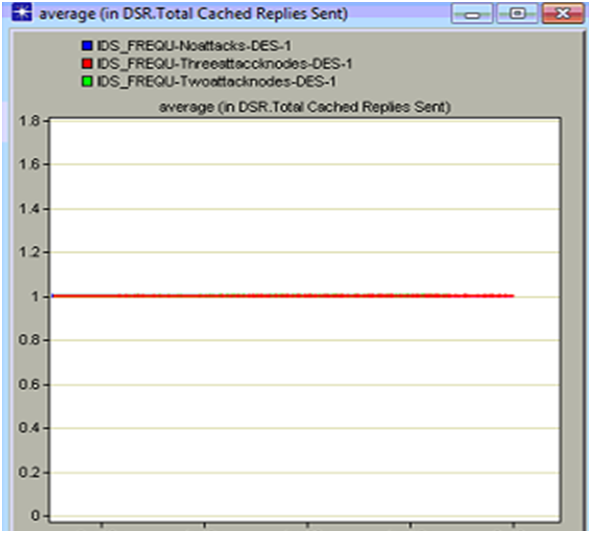
Cache replies indicates that the total number of replies sent by the server to the clients that were stored in the cache memory and in general these replies are sent to the clients where is some route loosening attitude of the nodes across the network. If the number of cache replies is more then it implies that there is lot of packet loss across the network and the nodes are frequently sending the route requests and this is common attitude of the intruder attack nodes across a wireless network.  Now the total cache replies sent by the nodes across the three scenario created is given in the below comparison graph 

 DSR total cache replies sent

It can be observed from the above graph the total cache replies sent by the server is more when there are some intruder attack nodes on the network. At the beginning of the simulation there are some cache replied due to the normal scenarios and later the total number of cache replies sent by the second scenario where there are two attack nodes and the cache replies sent by the third scenario where there are three attack nodes is more and these replies are sent till end of the communication process. In general where there are more cache replies across the network it indicates that there is lot of intruder traffic on the network and even if the frequency of the intruder attacked nodes increases the total number of cache replies are increases and thus there is lot of congestion across the network and also the total number of packet drops are increase exponentially. Thus when all the three scenarios are compared, more cache replies are sent when there are three attack nodes and thus it can be concluded that based on these number of cache replies the overall intruders on the network can be detected and prevented further. 

DSR total packets dropped 

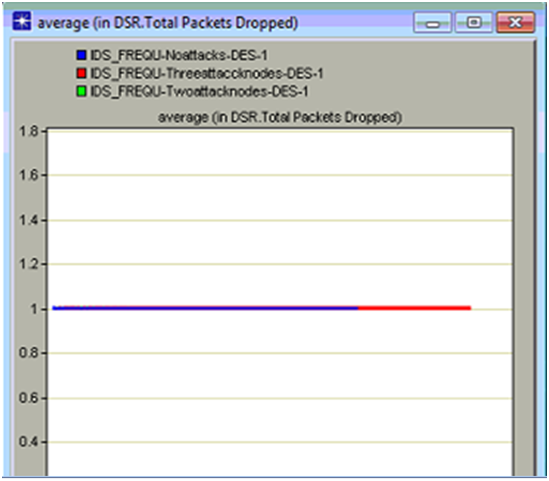
Packet drop across any network indicates the overall performance of the network in many aspects and in this simulation DSR routing protocol is used and the packet drop due to the intruder actions on the routing protocol parameters are estimated against the three scenarios created. Total number of packets dropped indicates that the anomaly traffic is more and due to this the actual traffic is lost by the nodes and the server and in this process the overall packets dropped is increased a lot and in this context the total packets dropped across the three scenarios is shown in the below comparison graph

 DSR total packets dropped

From the above graph it can be observed that the total packets dropped is more when there are three attack nodes on the network. Initially there is some packet drop across the network even in the case of no attack nodes and this drop is due to the normal traffic conditions and the kind of the application is used across the network to generate the required traffic and in general the packet drop should be limited and the same proved across the simulation. When the three intruder attack nodes scenario is considered the packet drop is more as the intruder packets are more and due to these packets the actual packets are lost and in this process all the nodes will lose the actual data packets and in this context the total number of packets dropped is increased and this drop will continue till end of the simulation. There is no packet drop with two attack nodes and this is mainly due to the reason that when all the important data packets are lost by the three intruders attack nodes, there is no scope to drop the data packets and thus the packet drop is not recorded in this process. 

DSR Total Route errors sent 

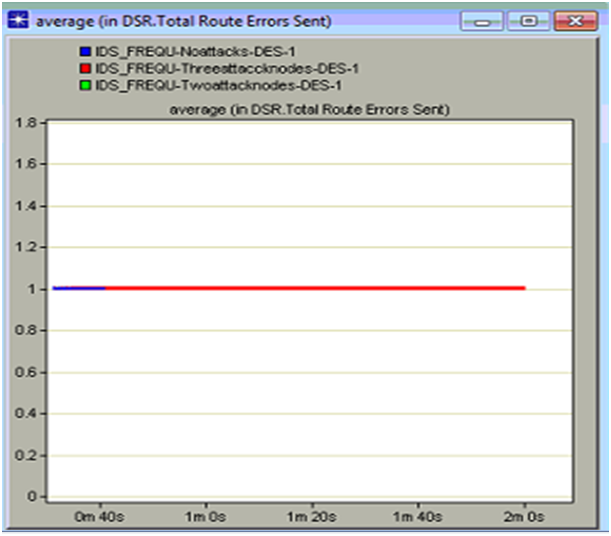
Route errors are common when there are some intruder actions across the network and if this error sent rate is more when the performance of the network is reduced a lot. In this context the total DSR route errors sent are analyzed and based on this the actual performance of the network against the intruder attacks is analyzed and the corresponding comparison graph is as given below

 DSR Total Route errors sent

From the above graph it is clear that the total route errors is sent is more with the three intruder attack nodes when compared to the other scenarios. The total route errors sent with the no attacks scenario us very less when compared to the three attack nodes scenario and this is due to the reason that when there are some intruder attacks on the network, more route discovery attributes are set and due to this the average number of router errors are more and they are sent across the network. When the server receives the route errors it will start processing these requests and in this process will keep the normal nodes on hold for long time and due to this even the packet drop is also increased a lot. It can be observed from the comparison result that when there are two attack nodes there are no route errors across the network and from this it can be concluded that the routing process is completely stopped when the three attack nodes has manipulated the traffic and there is no traffic to be processed with two attack nodes. 

Results analysis 

Intruder actions and the corresponding detection mechanism is proposed in this simulation and in this context three scenarios are created and the simulation is run for 5 minutes to achieve the comparison result. From the comparison results that it is clear that when there are more intruder attacks on the network, the performance of the network is reduced a lot in terms of packets drops, route errors, cache replies sent, traffic sent and traffic received. In this simulation the frequency of the intruder is increased gradually and with the increase in the intruder attack nodes all the DSR routing protocol parameters are changed in terms of the performance like more intruder traffic is sent and received when there are three attack nodes. Even the aspects like router errors sent, cache replies sent and the total number of packets dropped is more with the three attack nodes scenario and from this the actual intruder actions can be detected and eliminated further. Route discovery time is also more with the attack nodes scenarios and thus the server is busy in sending the routing requests and in this process the actual data packets are lost and based on all these analysis and comparison graph the intruder actions can be identified and eliminated completely

Project Report on Wireless Intrusion Detection System

Mobility Configuration 

As all the nodes used in this simulation process are mobile in nature, the required mobility is set using at this step. Mobile configuration node is used to set the required mobility to all the nodes and this can be done by following the below steps 

  • Right click on the mobile config node and check the option edit attributes
  • Choose the Random mobility profiles and expand the default random waypoint option to set the required mobility profile for all the mobile nodes
  • Now set the random waypoint parameters accordingly as shown in the screenshots in the appendix section
  • Once the mobile configuration settings are done, go the topology menu
  • Chose the option Random mobility and from there choose the option set mobility profile
  • Click ok on the warning message and click ok on the default random waypoint model
  • Once these steps are done, it can be observed that arrow marks are appended to all the mobile nodes and this indicates that required mobility is set to all the mobile nodes across the network

The detailed procedure followed in this context is shown in the appendix user manual section.

Performance metrics 

Thus the above procedure is followed to set the application and profile settings for the mobile nodes and the wireless LAN server and once these settings are done, the corresponding DES metrics should be chosen. As the main aim of this simulation is to understand the impact of intruders on the routing protocol and also detect the intruder actions based on the frequency of the number of nodes affected, few DES metrics related to routing protocol are chosen. In this scenario there are no attack nodes and the frequency is zero in this case. The process to choose the individual statistics is given in the below steps 

  • Right click on the workspace of the network and choose the option Choose Individual DES statistics
  • It can be observed that there are three level of performance metrics like Global statistics, Node statistics and link level statistics
  • Global performance metrics are used in this context and among them the key aspects like DSR routing protocol metrics are used across this simulation.
  • Expand the DSR metrics and then chose the option like route discovery time, routing traffic received, routing traffic sent, total cache replies sent, total packets dropped and total route errors sent are chosen to estimate the performance of the network against the intruder attacks
  • Once these options are selected click on Ok button to apply these changes

Detailed procedure to built the first scenario is given in this section and the simulation procedure for the next scenarios is given as below 

Scenario two 

In this Wireless Intrusion Detection System, two nodes are identified across all the 30 nodes and the parameters of the DSR routing protocol are changed.  This scenario can be created by just choosing the duplicate scenario from the scenarios menu and this network setup is similar to the first scenario and the required changes are done to nodes identified. As said, two mobile nodes are identified in this process and they are node 2 and node 4 and the DSR routing protocols of these nodes are changed accordingly such that they introduce the required intruder actions for the network. These two nodes are now considered as the attack nodes and they generate the anomaly traffic across the network and the actual parameters changed are explained as below 

Following are the actual attributes set for node 2 and they are changed to impose the intruder actions on the network 

  • Maximum buffer size is set to infinity
  • Expiry time is set to 50 seconds
  • Request table size is set to 10 nodes
  • Maximum request table identifiers is set to 16
  • Maximum request retransmission is set to 16
  • Maximum request period is set to 10 seconds
  • Initial request period is set to 0.5 seconds
  • Non propagation time is set to 0.03 seconds
  • Gratuitous router reply timer 1 second
  • Maximum buffer size is set to 100 bytes
  • Maintenance holdoff time is set to 0.25 seconds
  •  Maximum maintenance retransmission attempts are set to 2
  • Maintenance acknowledgment is set to 2 

Following are the attributes set for node 2 to impose the required intruder actions on the network

  • Maximum buffer size is set to 1000
  • Expiry time is set to 50 seconds
  • Request table size is set to 64 nodes
  • Maximum request table identifiers is set to 16
  • Maximum request retransmission is set to 32
  • Maximum request period is set to 10 seconds
  • Initial request period is set to 0.5 seconds
  • Non propagation time is set to 0.03 seconds
  • Gratuitous router reply timer 1 second
  • Maximum buffer size is set to 100 bytes
  • Maintenance holdoff time is set to 0.25 seconds
  •  Maximum maintenance retransmission attempts are set to 2
  • Maintenance acknowledgment is set to 2 

Scenario three 

In this scenario one more attack nodes are added and thus the total number of attack nodes in this context is four and this scenario can be generated by duplicating the second scenario. One more nodes like node 6 is changed at their attributes level to impose more intruder actions across the network and the actual parameters set in this context as given below 

Following are the attributes used for the node 6 

  • Maximum buffer size is set to 1500
  • Expiry time is set to 50 seconds
  • Request table size is set to 64 nodes
  • Maximum request table identifiers is set to 16
  • Maximum request retransmission is set to 16
  • Maximum request period is set to 50 seconds
  • Initial request period is set to 0.5 seconds
  • Non propagation time is set to 0.03 seconds
  • Gratuitous router reply timer 1 second
  • Maximum buffer size is set to 50 bytes
  • Maintenance holdoff time is set to 0.25 seconds
  •  Maximum maintenance retransmission attempts are set to 2
  • Maintenance acknowledgment is set to 2

Running the simulation 

Once all the scenarios are ready, they are run against the simulation and following steps should be followed in this context 

  • Scenarios menu is opened and manage scenarios option is selected
  • From there it can be observed that there are three scenarios like the normal scenario, two node attacks scenarios and three node attacks scenario
  • Make sure all the scenarios are saved before running the simulation
  • Set the simulation time to 2 minutes and it can be more also to derive more accurate results
  • Click on Ok button to run all the scenarios against the simulation time set. 

Once the scenarios are run, the results can be viewed and compared to understand the intruder actions and the corresponding overall performance of the network and the results obtained are explained in the next chapter at a detail level.  All the screenshots used to make this simulation step are given in the user manual part of the appendix section.

Project on Effectiveness of Monitoring for Intrusion Detection in Mobile Ad Hoc Networks

Introduction

As the main aim of this Intrusion Detection in Mobile Ad Hoc Networks project is to evaluate the impact of intruders on the Mobile ad hoc networks, OPNET simulation is used to achieve the desired results and the main design used to create the network is explained in the previous chapter. As described in the previous chapter three scenarios are used in this simulation process and the corresponding network setup and the simulation aspects are described in this chapter with reference to the important screens. Each and every scenario is explained against the important steps used in creating them and the corresponding details are given as below.

Simulation of scenarios one

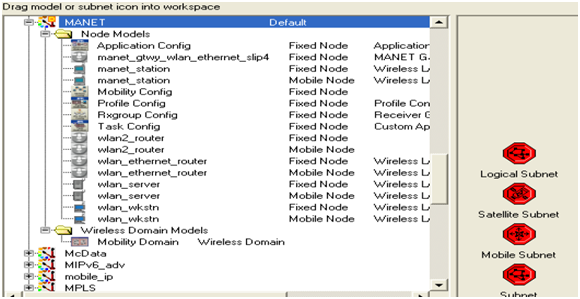
Detailed procedure followed to simulate the first scenario is explained in this section. The main of this scenario is to simulate a simple MANET without any attacks on the nodes and for this purpose 30 mobile nodes are considered as discussed in the design chapter. These mobile nodes are in general the wireless LAN mobile nodes and they can be dragged from the object palette and place over the actual workspace. A typical Object palette used for the MANET model is as shown below

Simulation of scenarios one

To create the MANET model across the OPNET modeler, the required model should be selected while creating the network stage itself and the actual procedure to be followed is explained in the form of below steps

  • OPNET modeler should be opened and New project should be selected from the file menu
  • Name the project as desired and also the scenario
  • Select the option Create Empty scenario from the next window
  • Campus is chosen as the required scale of the network and the size of the network is set to 1000 X 1000 square meters
  • From the node family, MANET is chosen and it can be done by changing the option No to Yes by just clicking on the corresponding option
  • Once all these steps are done, the actual workspace for the MANET network is created and the corresponding object palette is also created as shown above in the previous section.

The actual procedure to follow to execute these steps is given in the Appendix, user manual section with the corresponding screenshots as well.

Once the required MANET setup is ready, the very next step to be followed is to create the required network and this can be done by using the object palette. There are different objects available across the palette and they can be used to create the network and below are the key objects used in this simulation process.

  • 30 mobile nodes and they can be created using the WLAN workstations mobile
  • A single WLAN server fixed and this is used to control the mobile nodes across the network
  • Application configuration object and this can be used to set the required application definitions that generate the required traffic across the MANET
  • Profile configuration object and this is used to define the application profiles and the settings used are explained in the later section
  • Mobile configuration object and this is used to define the mobility profiles to all the mobile nodes and the required mobility patters are defined at this section.

When all the required objects are created, the required configuration settings need to be done and the actual process followed is as explained below. 

Application configuration definitions 

As given in the previous section, application configuration is used to create the required application settings to the network and they can be created across this node.  Database application is used across this scenario and this can be set across the application configuration node by clicking the edit attributes option on the application config. Following steps need to be executed to set the required application definitions 

  • Right click on the application config and chose the option edit attributes just by right click
  • Application definitions section is expanded to create the required number of applications
  • Enter the number of rows against the number of application and as database is the only application used in this process, a single row is sufficient.
  • Once the number of rows is given as one, name the application to DB (Database) and expand the option description
  • It can be observed that there are many applications available across this section and now chose the Database and change option from Off to On.
  • There are different option across the database application like low load, medium load and heavy load and in this scenario medium load is selected as the required option and once done these settings are applied by clicking on the OK button

The corresponding screenshots are shown in the appendix section. 

Profile configuration settings 

The process followed to create the application configuration definition is as given in the previous section and this section explains the configuration of profile. In general a profile is created for every application and in this scenario a single profile definition is created as there is only application created at the application definitions section. The actual steps to be followed to define the profile settings are as given below 

  • Right click on the profile configuration node and now chose the edit attributes option to edit the profile settings
  • Number of rows are given in the next step against the number of required profiles and as in this simulation process, only one application is used and this indicates that a single profile is sufficient and thus a single row is created in this context
  • Required profile name should be given once the required number of rows are created and as database is used the application, the profile is named as the DB and once this is step is done the actual settings to the profile definitions are done
  • Applications tab is expanded now to define the required application profiles and give the number of rows as one to support the database application
  • The actual application created is selected under this section and thus the required application is supported across this profile
  • Now the actual profile settings like start time, duration and end time are set and across this scenario the required start time are set to a constant value of 10 and the duration of the profile is set to end of the profile.

The actual process followed in this context is shown in the appendix section along with the respective screenshots. 

Mobile nodes and Server settings

Once the required application and profile settings are done, the mobile nodes and wireless LAN server settings should be done and the actual process to be followed is explained in this context. As mentioned 3o mobile nodes are used in this simulation process and a single wireless LAN server is used and the required attributes of these nodes are edited to set the required configuration. The first step to configure these nodes is to set the routing protocol and in this scenario DSR is used the routing protocol and the actual process followed is explained in the below steps 

  • Select all the mobile nodes and the wireless LAN server on the workspace and right click on any one of the nodes to edit the required attributes
  • To set the required routing protocol, Adhoc routing parameters option should be edited and there it can be observed that different routing protocols are available
  • Choose the DSR as the routing protocol and select the option apply to all the selected objects.
  • From these steps DSR is set the routing protocol used for all the mobile nodes and the WLAN server also 

Once the DSR is set as the required routing protocol, IP address should be assigned to all the nodes and this can be done by following the below steps

  • Select all the mobile nodes and wireless LAN and go to protocols menu
  • Choose IP and from this menu go to addressing option
  • There are different options available with respect to addressing and from those option choose the option Auto assign IPV4 address
  • Once done all the mobile nodes and the WLAN are assigned with the IP address

The actual procedure followed in this context is shown in the form of screenshots across the appendix user manual section. 

When the required routing protocol is chosen and IP address are assigned to all the mobile nodes and the wireless LAN server, now the created application and profile definitions should be applied to the mobile nodes and wireless LAN. There are two steps that can be used in this context and the first step is to select all the nodes and wireless LAN server and do the required settings against the attributes and the second procedure is to deploy the defined application method and they are as explained as below 

  • All the mobile nodes are selected and any one of the node is right clicked and choose the option edit attributes
  • Expand the section application supported profiles and choose the DB profile as the required profile to be supported
  • Check on the option apply to all selected objects such that the application profile is applied to all the selected objects
  • Now right click on the Wireless LAN and expand the application supported profile
  • Choose the DB and set the supported option and click ok two times to set the required profile to be supported by the server.
  • In the second procedure, go to protocols menu and expand the applications option
  • Now choose the option deploy defined application
  • A separate window is opened where all the mobile nodes and the servers are displayed on the left side and the corresponding source and destination are displayed on the right side of the window
  • Now choose all the mobile nodes and also the source option and drag all the nodes to the left side by clicking on the deploy option
  • Choose the server on the side and deploy it on the left side of the window and the consistency of the network can be checked with the help of Check consistency button.

This procedure is explained with the help of screenshots provided in the appendix section. 

Intrusion Detection System Final Year Project

Introduction 

This chapter focuses on the key design aspects followed in the simulation process and the key aim of this chapter is discuss all the design patterns followed and the corresponding simulation standards used in creating the simulation environment. As the main aim of this Intrusion Detection System Final Year Project is to evaluate the intruder detection across the large networks based on frequency measures, a simple mobile ad hoc network is considered as the required network and almost 30 nodes are considered in this context and the simulation is done by generating the required traffic and DSR is used the routing protocol and the actual design used is explained as below. 

Simulation tool used 

There are a variety of simulation tools available to simulate the mobile ad hoc networks and the key among them are OPNET modeler, OMINET and NS2 and among all these tools, OPNET provides a rich user interface for the simulation. OPNET supports many models across the simulation and also provides the scope to analyze the results using a large set of performance metrics. 

Few important technologies like MANETs, Wi-Fi, ad hoc networks and wireless sensor networks can be simulated very easily using the OPNET modeler and the basic simulation model that can be developed using the OPNET modeler is as given below
 Simulation tool used

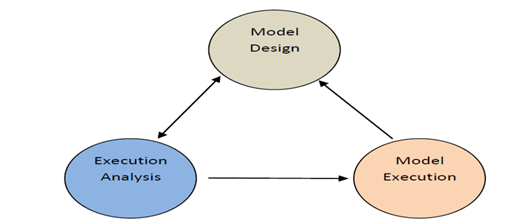
To proceed with the simulation, a perfect model design is required and once the model is created, it can be executed using the simulation process and finally the results can be analyzed.  The actual software and hardware requirements for installing the OPNET are given in the appendix section. 

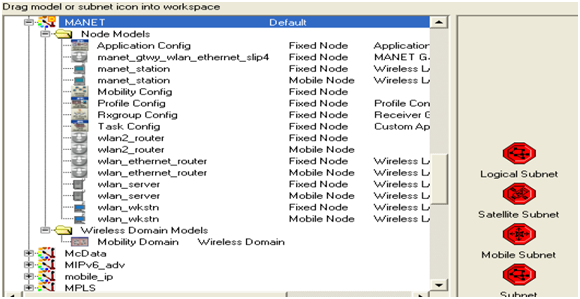
OPNET provides a rich user interface to the simulation of MANET model and even there are some default and configurable models against the MANET simulation and they can be used to create the required MANET setup very easily.  OPNET provides a simple feature known as object palette and this palette can be used to drag and drop the required objects to create the MANET environment and the below figure shows the typical OPNET modeler object palette
 OPNET modeler object palette

Design of scenarios 

As the main aim of this Intrusion Detection System Final Year Project is to detect the intruder actions across the networks using the frequency based metrics, three scenarios are considered in this simulation process and the key metrics used are as given below. 

No attacks scenario 

This is the first scenario used across the simulation and in this design, 30 mobile nodes are used and few configuration settings are done in this scenario. Following are the key nodes used across the simulation process and they are as listed below 

  • Mobile configuration and this node can be used to set the default mobile configuration settings for the mobile nodes considered as the simulation process
  • Application configuration node and this node can be used to define the applications to be supported across the simulation process
  • Profile configuration node and this can be used to set the required profiles for the application defined across the application configuration phase
  • 30 mobile nodes and these nodes are configured using the wireless LAN mobile nodes that are available in the object palette as discussed in the previous section
  • A fixed wireless LAN server and this server handles all the requests from the 30 mobile nodes used 

Once all these nodes are dragged and dropped across the workspace of the simulation environment they require configuration settings are done to proceed with the simulation process and the corresponding screenshots for setting the configuration details are given in the appendix section. The actual simulation parameters used to setup the network are as given in this section. As discussed 30 mobile nodes are considered and MANET is chosen as the required model family.

A network scale of 1500 X 1500 square meters is considered across a campus and the simulation is done by using all the nodes as discussed in the previous section.  DSR is considered as the required routing protocol and all the mobile nodes and the wireless LAN server are assigned with this routing protocol and the simulation is run for 2 minutes to get the desired results. 

The basic application used in this simulation is Database application and this application generates the required traffic across the all the mobile nodes and the wireless LAN server using the DSR routing protocol and the corresponding settings are done across the application configuration node as discussed above.

This database application is chosen and the corresponding parameters are set across the simulation process to generate the required traffic and this application is supported by all the mobile nodes and the server used in the simulation process. Once the application configuration settings are done the very next step is to define the profile settings and this can be done using the profile configuration node as given in the previous section.

Required number of rows are added to the profile tab and the corresponding applications created across the application configuration level are added to the profile and this means that now a separate profile is created for the application defined and this profile is used by all the mobile nodes and the wireless LAN server to generate the required traffic against the application being used across the network. 

Now once the application and profile configuration settings are done, now the actual mobile nodes and server should be configured to generate the required traffic. All the mobile nodes are selected and their attributes are edited to support the applications and profile created and the actual process is given in the simulation procedure chapter.  The actual parameters used in the configuration process are as listed below 

  • Application destination preferences
  • Application source preferences
  • Application supported profiles and
  • DSR routing protocol parameters 

All the parameters are set against the simulation process and as this scenario deals with no attacked nodes, all the default parameters for the DSR routing protocol are used and they are varied to generate more traffic and illegal routing requests in the next two scenarios.  Once the node level and the server level settings are done, the required IP Addressing is assigned to all the mobile nodes to create the required addressing scheme.

As the nodes used in the simulation process are mobile in nature, mobility is required for the nodes and this can be done by configuring the mobile configuration node as discussed in the previous section.  Default random waypoint mobility is used for the simulation process and this can be done by doing some setting at the mobile configuration node and the actual settings and the corresponding procedure followed is discussed in the simulation procedure chapter. Once the required mobility is set for all the nodes across the MANET, now the performance metrics should be initiated to estimate the required results.  

OPNET provides three levels of performance estimation like the global level, node level and link level. Global level metrics are used across the design of the simulation and the key metrics used to collect the results are as listed below 

  • Route discovery time
  • Routing traffic sent in packets per second
  • Routing traffic received in packets per second
  • Total cache replies sent
  • Total packets dropped
  • Total route errors sent

All the metrics are set across the simulation process and the simulation is run for 2 minutes to gather the required results and the next scenarios used in the simulation process are as given below 

Two attack nodes scenario 

The actual design followed to create this scenario is similar to the first scenario and this can be achieved by just duplicating the scenario. Once the scenario is duplicated, two mobile nodes are identified and the corresponding settings are changed for the DSR routing protocols. Following are the actual parameters changes for the DSR routing protocol and in general when a node is attacked by the intruders, the corresponding routing protocol parameters are varied and more and improper traffic is generated across the network and this traffic is considered as the anomaly traffic. Following are the actual attributes of the DSR routing protocol that were changed and they are listed below 

  • Sending buffer parameters
  • Router discovery parameters
  • Route maintenance parameters

All these parameters are varied against the default values to create the anomaly traffic across the network and the actual values used to create this anomaly traffic are discussed in the simulation procedure chapter. 

Three attack nodes scenario 

This scenario can be created by just duplicating the second scenario and the in this case three nodes are identified as the attack nodes and the corresponding anomaly traffic is generated by these three nodes. Similar to the previous scenario, the parameters of the DSR routing protocol are changed to generate the required anomaly traffic and the same parameters as discussed in the previous scenario are changed across this simulation process. 

Once all the required scenarios are created, the simulation is run for 2 minutes and similar performance metrics are used for all the scenarios as discussed above. Once the simulation is successful the results are compared against all the scenarios and the actual intruder detection is evaluated. The actual simulation procedure followed and the results achieved are explained in the later chapters of this project.

DFT implementation

As the main aim of this Intrusion Detection System MS Final Year Project is to detect the intruders across the networks using the DFT (Discrete Frequency Transformation), the attributes of the routing protocol are changed in a manner such that a DFT code is generated across the back end in C++. The number of intruder nodes are increased scenarios by scenario and the random selection done against the scenarios purely depends on the DFT equations and thus in the second scenario two nodes are selected and in the third scenario three nodes are selected as the intruder nodes and their routing protocols are changed against the DFT equations.

Intrusion Detection Techniques for Mobile Wireless Networks MS Project

Intruder can be considered as the main security threats across the network security and there are many intruder detection techniques across the literature proposed and most of them concentrate on the dynamic intruder actions. Frequency of the intruder actions has not given vital importance and in this project a frequency based intruder detection mechanism is explored using the OPNET modeler simulation.

Mobile Wireless Networks considered as the wireless network and three scenarios are created where a total of 3o mobile nodes are used and a single wireless LAN server is used for the simulation and to compare the performance of the proposed design three scenarios are created. First scenario has no intruder attack nodes and the second scenario has two intruder attack nodes, where the frequency of the intruder attack nodes is increased to three and the simulation is run for 5 minutes to evaluate the results and the key findings are as given below 

Intruder actions and the corresponding detection mechanism is proposed in this simulation and in this context three scenarios are created and the simulation is run for 5 minutes to achieve the comparison result. From the comparison results that it is clear that when there are more intruder attacks on the network, the performance of the network is reduced a lot in terms of packets drops, route errors, cache replies sent, traffic sent and traffic received.

In this simulation the frequency of the intruder is increased gradually and with the increase in the intruder attack nodes all the DSR routing protocol parameters are changed in terms of the performance like more intruder traffic is sent and received when there are three attack nodes. Even the aspects like router errors sent, cache replies sent and the total number of packets dropped is more with the three attack nodes scenario and from this the actual intruder actions can be detected and eliminated further. Route discovery time is also more with the attack nodes scenarios and thus the server is busy in sending the routing requests and in this process the actual data packets are lost and based on all these analysis and comparison graph the intruder actions can be identified and eliminated completely. 

Project background

Network security and information security are the two common issues faced across the networking world these days and there are many research papers and articles issued with respect to these two aspects. Network security of different networks is affected with lot of threats and there are many possible solutions introduced with respect to the network security and still there is always a new problem across the network security that makes the administrators sleep less.

Among most of the network security issues, intruders are given the top priority and there are many intruder detection techniques in place to identify and protect the network from these intruder attacks. Irrespective of the number of intruder detection techniques implemented, still there is an array of actions populated by the intruders which were undetectable by the existing intruder detection techniques. Filtering these intruders is always a challenging and never ending task to most of the organizations as the intruders always find new ways to disturb the network security.

There are many intruder detection techniques implemented by the organizations and no one is 100% secure with respect to identifying the intruder actions and most of these techniques fail at the initial stages only. In general a typical intruder detection system helps the security managers to detect the anomaly actions in prior to the attack or after the attack and most if the organizations are not confident about the performance of the IDS implemented across them and thus look for a new version of IDS that can work better in terms of intruder and anomaly detection aspects.

In this Intrusion Detection Techniques for Mobile Wireless Networks MS Project a frequency based intruder detection system is evaluated where few key aspects like the size of the packet payloads, inter arrival time of the packets, the number of IP addresses reached at a particular time and the number of ports accessed and this information is really helpful to develop a perfect IDS. Frequency of the intruder actions will impose intruder and anomaly traffic on the network and due to this the overall performance of the network and the applications and the prefect IDS required in this context to reduce the frequency of the intruder actions and also identifying the intruder actions across the network. In general the intruder actions will affect the complete behavior of the routing protocol used across the communication process and due to this the core parameters of the protocols are changed and they will impose vulnerable network traffic and the server and nodes of the network can’t handle this amount of traffic.

Due to this impact the network till develop the tendency to drop the packets and generates more routing errors on the network.  If the packet drop and the routing errors on the network are more the routers and the servers across the network will be affected with the congestion and thus the optimal performance metrics are affected a lot due to this implementation. Thus the frequency of the intruder actions will place an recoverable impact on the network and thus a solution is required in this context and the main aim of this project is to develop an frequency based IDS and the main problem identified is given below 

Problem definition 

As mentioned the main aim of this project is to design and IDS that can detect the intruder actions to identify the frequency of the intruder impact and in this context a mobile ad hoc network is created using the OPNET modeler simulation tool. A single wireless LAN server and 30 mobile nodes are used in this simulation model and three scenarios are created where each scenario is designed with an aim to increase the frequency of intruder actions. First scenario is created with an aim to impose null intruder actions on the network and zero attack nodes are created, where the second scenario is created with two intruder nodes and the third scenario is created with three attack nodes and thus the frequency of the intruder actions is increased to impose the anomaly traffic on the network.

A routing protocol is always required to establish the connections across the wireless and mobile nodes and even the main target of the intruder actions is to violate the core functional behavior of the routing protocol and thus DSR is considered as the routing protocol. All the nodes identified to act the intruder nodes are changed against the DSR routing protocol in terms of the routing parameters and thus the three scenarios are compared and the overall performance of the network due to the attack nodes is analyzed. Few important performance metrics of the network like route discovery time, total packets dropped, total cache replies sent, total route errors sent are analyzed against the three scenarios created and performance of the proposed IDS is evaluated. The key aims and objective identified in this context are as given below 

Aims and Objectives

Aim: To evaluate and design a frequency based intruder detection technique to detect the anomaly traffic using OPNET simulation. 

Objectives

Following are the research objectives 

  • To critically review the network security and the impact of Intruders on the network security
  • To review different types of intruder detection techniques and evaluate the limitations of them
  • To design a Discrete Fourier Transform (DFT) based frequency analysis approach to detect the intruders
  • To design the required scenarios using OPNET
  • To implement the scenarios using OPNET simulation to detect the anomaly traffic data
  • To evaluate the scenario results and estimate the performance of the system developed. 

How the objectives are achieved 

  1. Different articles, journal and ACM digital library is used to gather the required primary information
  2. These references are used to review the existing intruder detection techniques are evaluate the limitations of them
  3. Basic working principles of Discrete Fourier Transform (DFT) are analyzed with respect to frequency analysis issues in detecting the intruders
  4. Required network setup is designed with a firewall on each target system and all the systems are connected to the hub
  5. This network setup is designed using OPNET modeler tool and the design aspects followed are discussed in detail
  6. Different attacks like TCP based attacks and traffic data attacks are simulated using the OPNET simulation tool
  7. Almost 30 pc connections are considered and frequency patterns in detecting the attacks are analyzed
  8. This analysis is used across the results evaluation process and the results are analyzed with respect to the data traffic of the victim PC’s and the corresponding frequency patterns.

A frequency based approach to intrusion detection MS Project

Project background 

Network security and information security are the two common issues faced across the networking world these days and there are many research papers and articles issued with respect to these two aspects. Network security of different networks is affected with lot of threats and there are many possible solutions introduced with respect to the network security and still there is always a new problem across the network security that makes the administrators sleep less.

Among most of the network security issues, intruders are given the top priority and there are many intruder detection techniques in place to identify and protect the network from these intruder attacks. Irrespective of the number of intruder detection techniques implemented, still there is an array of actions populated by the intruders which were undetectable by the existing intruder detection techniques.

Filtering these intruders is always a challenging and never ending task to most of the organizations as the intruders always find new ways to disturb the network security. There are many intruder detection techniques implemented by the organizations and no one is 100% secure with respect to identifying the intruder actions and most of these techniques fail at the initial stages only.

In general a typical intruder detection system helps the security managers to detect the anomaly actions in prior to the attack or after the attack and most if the organizations are not confident about the performance of the IDS implemented across them and thus look for a new version of IDS that can work better in terms of intruder and anomaly detection aspects.

In this project a frequency based intruder detection system is evaluated where few key aspects like the size of the packet payloads, inter arrival time of the packets, the number of IP addresses reached at a particular time and the number of ports accessed and this information is really helpful to develop a perfect IDS. A typical Discrete Fourier Transform (DFT) frequency analysis techniques used for the signal processing is used in this project to detect the frequency of the intruder and anomaly actions. Following are the aims and objectives of this project 

Aim: To evaluate and design a frequency based intruder detection technique to detect the anomaly traffic using OPNET simulation. 

Objectives

Following are the research objectives 

  • To critically review the network security and the impact of Intruders on the network security
  • To review different types of intruder detection techniques and evaluate the limitations of them
  • To design a Discrete Fourier Transform (DFT) based frequency analysis approach to detect the intruders
  • To design the required scenarios using OPNET
  • To implement the scenarios using OPNET simulation to detect the anomaly traffic data
  • To evaluate the scenario results and estimate the performance of the system developed. 

How the objectives are achieved 

  1. Different articles, journal and ACM digital library is used to gather the required primary information
  2. These references are used to review the existing intruder detection techniques are evaluate the limitations of them
  3. Basic working principles of Discrete Fourier Transform (DFT) are analyzed with respect to frequency analysis issues in detecting the intruders
  4. Required network setup is designed with a firewall on each target system and all the systems are connected to the hub
  5. This network setup is designed using OPNET modeler tool and the design aspects followed are discussed in detail
  6. Different attacks like TCP based attacks and traffic data attacks are simulated using the OPNET simulation tool
  7. Almost 20 pc connections are considered and frequency patterns in detecting the attacks are analyzed
  8. This analysis is used across the results evaluation process and the results are analyzed with respect to the data traffic of the victim PC’s and the corresponding frequency patterns. 

Reasons to choose this project 

In general there are different types of intruder detection techniques to identify the intruder and anomaly actions. Apart from the lot research and knowledge gained with respect to the intruder detection techniques, there is always a new type of intruder action identified when I am doing the review, thus I thought of evaluating a frequency based intruder detection system using OPNET simulation tool. 

Resource requirement 

Software requirements 

OPNET modeler 14.0 or later

Operating system: Windows 7 

Hardware requirements 

PROCESSOR        :    PENTIUM IV 2.6 GHz

RAM                    : 1 GB  

Project Plan 

Task Description Start Date


End Date


Duration
Introduction


Basic introduction to the project along with the problem definition and aims and objectives are defined in this section.


    1 week


Literature review


Following aspects are covered under literature review

Following aspects are covered under literature review


  • Review on network security issues and the impact of the intruders on the network security
  • Review on various intruder detection techniques and their limitations
  • Analysis on the frequency based approach to detect the intruders.


    4 weeks


Design


Following design aspects are covered under this section

  • Scenarios design
  • Parameters design


    3 weeks


Simulation


Following aspects are covered under the implementation section

  • Network setup
  • Simulation of the scenarios
  • Running the scenarios against the parameters


    4 weeks


Evaluation of results


Results achieved after running the individual scenarios and after comparing the scenarios are explained in this chapter with reference to the aims and objectives of this project.


    2 weeks


Conclusion and Future work


Conclusion from the total work done and the results evaluation is given and the better ways to improve the project in future are also explained.


    1 week


Deliverables 

Following are the deliverables of the project 

Initial report contain the below aspects 

  • Introduction to the project and problem definition
  • Aims and objectives of the study
  • Review on network security issues

Interim report contain the below aspects

  • Review on different intruder detection techniques
  • Review on their limitations
  • Analysis on frequency based intruder detection technique
  • Design steps of the scenarios considered

Final report contain the below aspects 

  • Information from both the initial and interim report
  • Design steps of the scenarios
  • Simulation to the proposed design
  • Evaluation of results
  • Conclusion and future work

Final product holds the below information 

  • Frequency based intruder detection system
  • Simulation results and evaluation of the results

Implementation of Wireless LAN Security Using OPNET

When a low quality speech is imposed across the voice the speech quality is increased due to the low noise across the network and the quality of service requirements are imposed due to the GSM quality speech on the network and thus the overall performance of the voice application is increased a lot due to the GSM application. When the load is compared across the three scenarios it is clear that the overall load on the network is more when the IP telephony is considered as the required application and when the GSM is considered the load is reduced a lot and a maximum value is imposed which is very less than the other two scenarios.

Low quality speech application is considered an optimal load on the network is imposed and thus from the overall analysis it is clear that the quality of service requirements is enhanced with the GSM quality speech. When the medium access delay is considered for the three scenarios the load is more with the IP telephony network and this due to the IP protocol implementation and this will reduce the quality of service on the network. 

A minimum load on the network is imposed due to the GSM network and for this implementation the overall quality of service requirements against the voice application and even in this case the low quality speech also imposed the optimal medium access load on the network.

From this overall analysis it is clear that to improve the quality of service across the voice applications GSM level standards are required and this fact is proved in this context. It is observed when the network load is considered more load on the network is imposed due to the IP telephony and this due to the fact the IP protocol is imposing more traffic on the network rather than the CBR traffic that was generated by the GSM and low quality speech.GSM in general generated the CBR traffic where a constant traffic is directed towards the voice destination and thus the overall the network load on the network is reduced a lot.

From this analysis it is clear that if GSM quality speech is used at the application level the impact on the quality of service requirements is directly adopted and it is increased a lot in this context. It can be observed that the overall retransmission attempts made by the GSM quality is very less when compared to the IP telephony and the low quality speech and this indicates that the GSM is best suited to ensure the quality of service requirements and also the case of losing the packets is reduced a lot as the attempts made due to lose of the route is very less.

When the case with the IP telephony is considered the retransmission attempts are very more and a maximum value of 0.65 is recorded and this indicates that the quality of speech is suppressed and also the optimal conditions are violated.

Thus from this overall analysis it is clear the total retransmission attempts are reduced due to the GSM quality aspects and thus the overall performance is improved at the same time against the quality of service requirements.

When the throughput is more the quality of service is reduced a lot and thus in this context the GSM quality voice application is imposing a very less throughput and thus the quality is improved in this context where the maximum throughput is due to the IP telephony as the IP protocol impose more traffic on the network and due to this the overall throughput is increased.

When the case with the low quality speech is considered an optimal throughput is occurred and due to this the overall voice performance is reduced a lot. From the overall analysis of the results it is clear that the quality of service across the voice applications can be improved with the GSM quality voice application. 

Future work

Apart from the work done towards this simulation there is few aspects that need to covered in future and they are as listed below 

  • More number of voice applications can be compared in future to estimate the quality of service requirements
  • More scenarios can be created and more performance evaluation aspects can be compared to understand the importance of quality of service requirements for voice applications

Performance of LAN against Different Load Conditions Using OPNET

In general the Performance of LAN against Different Load Conditions Using OPNET IP telephony need more attention towards the CBR traffic and due to the CBR traffic the packet delay variation is increases a lot and thus the overall quality of service offerings is reduced a lot when compared to the other voice applications. The packet delay variation occurred with the GSM quality speech is very less and is almost zero and this indicates the packets are transferred with an optimal rate without any delay across the network and thus the quality of service is increased a lot in this context.

The packet delay variation occurred with the low quality speech is also less when compared to the IP telephony and this indicates that the overall noise across the speech is suppressed at this level and thus the packets are delivered at an optimal rate and thus the overall analysis it is clear that the quality of service can be increased with a low packet delay variation and again this can be achieved with the GSM quality voice application to improve the quality of service. . It can be understood that the packet end to end delay is very less with the GSM quality speech and it is almost zero where the packet end to end delay is more with the low quality speech when compared with GSM and very less when compared with IP telephony.

In general when there is low packet end to end delay then the optimal performance of the network against the quality of service requirements for a voice application can be ensured and the same is proved in this comparison. When all these three scenarios are compared now the quality of service requirements with the GSM speech is at the optimal level and thus always the GSM attributes are perfect at the quality of service requirements. The average traffic received at the voice destination is shown in the above graph. It is clear that the overall traffic received at the voice destination is more with the GSM quality speech when compared to the other two scenarios.

A low traffic is received with the IP telephony and this indicates that ample number of CBR traffic packets are not received at the destination side and thus the quality of service is depressed a lot with the IP telephony application and when the case with the low quality speech is considered an optimal traffic received and even this value is less than the GSM quality speech. From this overall analysis it can be concluded that the quality of service requirements can be enhanced with the traffic received and thus in this case it is understood that GSM quality voice applications are best suited to deliver more traffic and also ensure the maximum quality across the network. 

From the comparison of the three scenarios it is clear that the overall traffic received in packets per second is more with the GSM speech and also the value is constant when compared to all the other two scenarios.  When the traffic received is more it indicates the overall performance of the network is increased in terms of quality delivery and thus from this comparison process it is clear even the traffic received is more with the low quality speech and this indicates that at the idle conditions the low quality speech is increased in terms of the traffic received and thus the overall quality of service is increased due to the traffic received.

A Frequency Based Approach To Intrusion Detection:

Even from this simulation process this indicates that the GSM quality speech is required to ensure the best quality of service requirements. From the analysis if the average traffic sent it is clear that the overall traffic sent is more with the IP telephony and this is due to the reason that the telephony applications impose more traffic by the nodes and with this much traffic the overall traffic sent is increased and the nodes loose the core compatibility of against the quality of service requirements.

A low traffic is sent with the GSM quality speech and this indicates that the quality of service requirements across the voice application can be increased due to the GSM quality speech. The traffic sent by the low quality speech is also more when compared to GSM and thus even a constant traffic sent and thus the overall quality of service requirements is perfect for the GSM quality speech even in this case. When the traffic sent in packets per second is compared a more traffic is sent is with the IP telephony and thus the overall quality of service is reduced a lot and also the value has started after 3 minutes of simulation time.

When the case with the GSM is considered the overall traffic sent is very low and this indicates that the quality of service requirements are enhanced with the GSM speech and even in this case the GSM is proved to be the best quality of service requirements imposed for the voice applications. When the delay incurred across the network is compared with the three scenarios is compared the overall delay is very less with the GSM speech and this indicates that the voice transmission is very fast at the GSM level and the highest value is more with the IP telephony and an optimal delay is incurred with the low quality speech.