
In this Analyzing Online Shopping Data application load the data from MS Excel and Resolved Synthetic keys with Concatenate and by renaming the field names.
We are using different sheet objects like the List box, Input box, Straight table, current selection and Charts (Bar Chart, Pie Chart, and Line chart).
List box: A list box represents the list of all the values of a specific field.
Current selections box: In the current selections box, selections are listed by field name and field value.
Search Object: Search objects can be used for searching for information anywhere in the document.
In this QlikView application, we are implemented four functionalities
- Return Analysis
- Shipping Analysis
- Report
- Comparative analysis
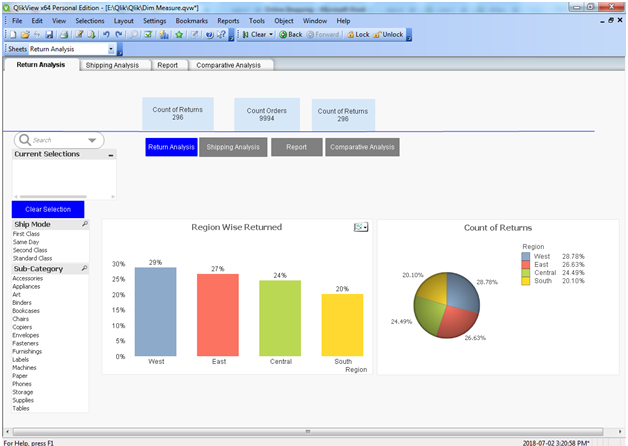
Return Analysis:
In Return Analysis calculate a total number of orders and returns.
We create fast change. Fast change to convert bar chart to line chart. Bar chart analyzes Region Wise Returns and line chart is primarily suitable when you want to visualize trends and movements over the region.
Use Pie Chart to represents a count of return value percentage in a circle with different colors.
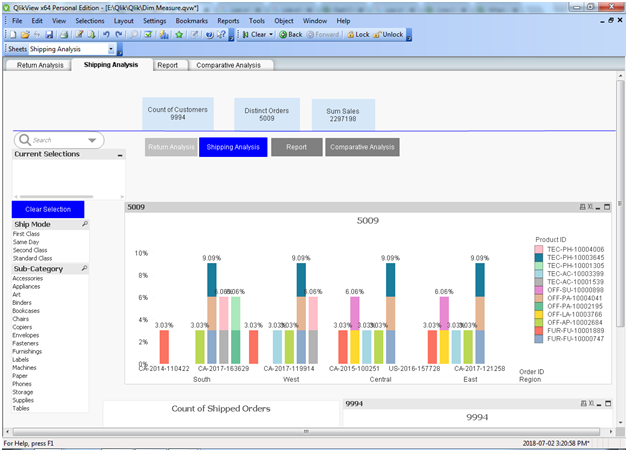
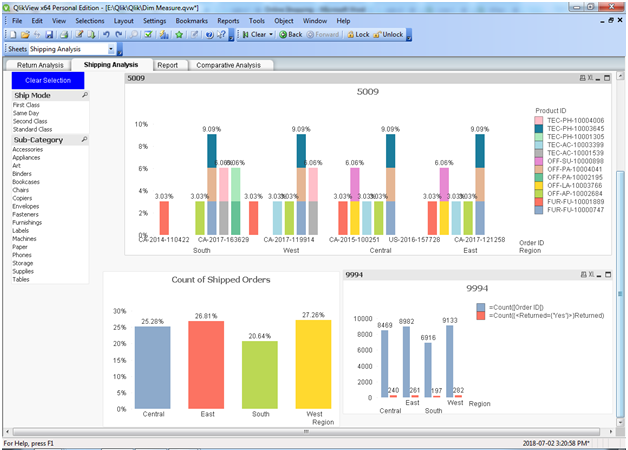
Shipping Analysis
In Shipping Analysis to calculate the total number of shipped orders on region wise.
In Bar chart use ship mode and product category to calculate region wise shipped product sales and orders.
We can use a pie chart to calculate the percentage of shipped orders in region wise.
Report
In report calculate total no of sales and returns based on product category and region wise.
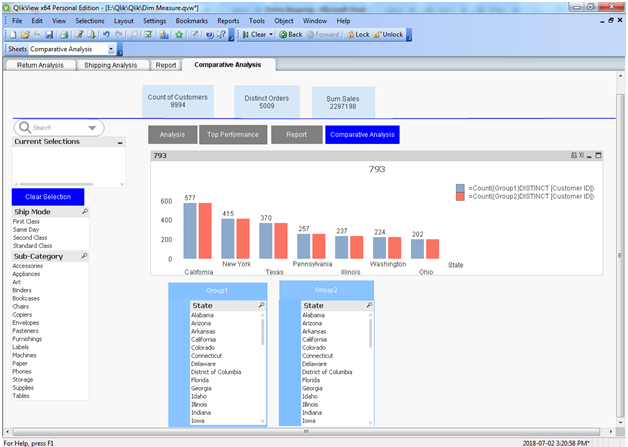
Comparative analysis
The comparative analysis we are going to compare state wise distinct customers.
Download the Analyzing Online Shopping Data QlikView Project.