Energy Management System Python Project

ENERGY MANAGEMENT

  • This is a project on energy management.
  • The project helps to save energy.

Description

  • First, create an IBM cloud account with an e-mail address and password.
  • Then create an IoT platform and node-red platform.
  • We need to write a python code for it because it is a real-time example.
  • Create an MIT app.

First, create an IBM cloud account with an e-mail address and password

Go to google and search for IBM and create an account using your email address and log in to the page. we will get the interface as an IBM dashboard.

CREATING IBM PLATFORM

After creating an IBM account there will be a search option then we can able to see it. Type Internet of things there will be a platform called the internet of thing in that u can able connect the so many services in that internet of things and create a service in that it will ask u to launch it and for creating an internet of things u need some keys as API keys, Device connects and so many things will fill and u can able to see an option as the add device click on new device u can see the device has been created for that u need to keep the API keys, Device information safely in the note pad because it will help u at the need for connecting it.

WRITE PYTHON CODE

we are writing python code because we are going to deal with a real-time example so we need to use python. actually, our project is about how much electricity is causing monthly and its estimated cost
In this, we are writing about fan, light, washing machine, tv, and ac let s take some random values in that because we can’t able take the exact values, and then we need to add all of the to know the charge and then we need to find out the estimation money for it. after completion of this code, u can able to know the code is running.
we need to send it to the IoT platform so we need to install pip by command prompt and then write the code separately so u can able to run and send information to the IoT platform. For sending to the IoT platform we need to give information in a notepad.

python code:

python running code

Information on IoT platform

Creating node-red platform

For creating a node-red platform we need to search in IBM as a node-red app then u can able to see the node app then create it as the local u can create node-red is nothing but we will get the information in the form of a flow chart.
we need to install IoT in, IOT out will be in the node-red app itself and then u can able to use it for better ability and experience we will use the gauge tool and for doing it on the web we will use the HTTP in, HTTP response and then we will use the payload option to print in and I will show u the flow chat I had created and when we run the program u can see the outputs are coming in the debug option.

Create an MIT app.

Search for the MIT app and click on create apps.

First, we should design the app page with alignments given on the left side of MIT. with horizontal alignments drag them to the screen and edit those with suitable markings.
And next insert a text box into the screen. As we have taken energy management the as a fan, ac, light, tv, etc.
Now insert 5 text boxes to the screen and assign the markings. Take two buttons one as checked and another as not checked.

And the two text boxes with one as charge gives the charge of every applicant and another as cost, which gives the summation of all applicants.

This is done and next tap to blocks button. In that create the blocks with URL.

Paste the URL which we have I IBM as:

Now tap on the build option and get the QR code and scan the code you will receive an apk file and install the file and app.

Now the click on the checked button now the values, cost, and charges will be displayed on the screen in their respective blocks.

Restaurant E-Management System Salesforce Project

Restaurant E-management Workflow:

  1. A customer looks for the menu on the mobile device available on the table.
  2. The customer selects the menu items and confirms them.
  3. Customers can view the orders in the cart.
  4. The order will be displayed on the devices available in the kitchen.
  5. The customer has the option to modify the ordered item unless the chef starts preparing the item.
  6. The item will be marked as Pending until the chef starts cooking it.
  7. The chef starts cooking the food and marks the status as Preparing.
  8. Chefs prepare the food item and change the status to Ready.
  9. The servers will pick up the food from the counter and serves it at the appropriate table.
  10. Customers can order the food many times. The above process will be repeated.
  11. Also, customers can view the bill till now before generating the actual bill.
  12. When the customer finishes, he selects generate bill option and pays the bill.
  13. Customers will also have the option to fill in the survey.

System users

  1. Customer
  2. Chef
  3. Waiter (Server)
  4. Restaurant Manager
  5. Inventory Manager

Functionalities of the users

Customer:

The customer enters a restaurant. The manager will look for empty tables with a specified number of people. The table will be allocated to the customer. The customer will have a device on the table through which he can order the food items.

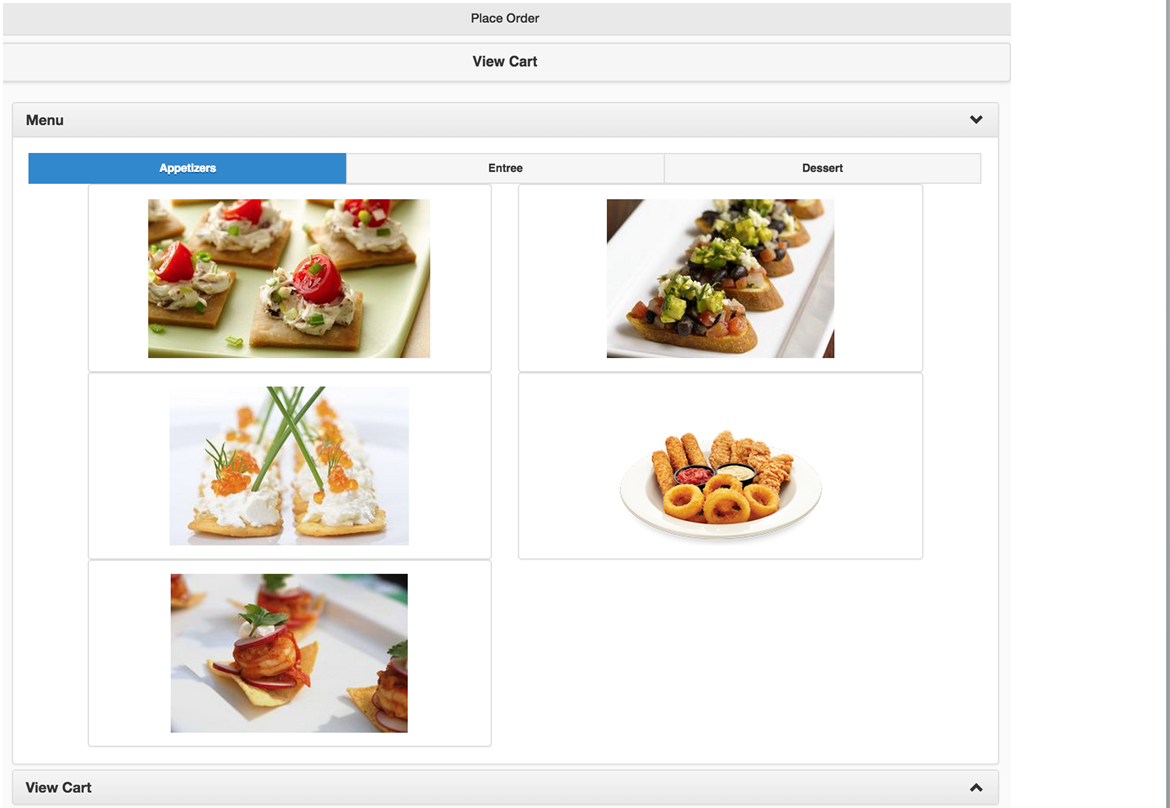
Customers can browse through the menu. He can choose categories from appetizers, entrees, and desserts. There is also a sub-category for vegetarian non-vegetarian and vegan. Menu items are classified on these criteria.

Main menu page where a user can browse through different categories. The default section is the Appetizers as highlighted above.

Customers can browse through another section. Here the customer is in the Entrée section.

Customers can select the menu items and use the ‘+’ & ‘-’ signs to increase/decrease quantity respectively. Add those to the cart using the ‘Add’ option. The order of items will be the order in which they are added to the cart on the right.

Clicking on Add button adds the items to the cart on the right side.

Customers can see the top-selling items in the restaurant in each of the sections with a star mark on them.

Customers can view the bill and cart on the right side of the screen. It will contain a list of items selected by the customer. Once the customer clicks on ‘Place Order’ the items get added to the ‘Billed Items’ section. Customers can add or remove items from the cart using the ‘Edit Order’ button. Customers can also clear the entire cart by using the ‘Reset Cart’ option.

Items are added to the cart and then placed order items are under the Billed Items section.

Customers can view the total bill for the ordered items. When the customer clicks the ‘Place Order’ button, the items from the cart are moved to the ‘Billed Items’ section. These confirmed items are now displayed on the chef’s screen for processing.

Chef’s screen as and when the order is placed by the customer.

The customer can edit these items before the chef clicks the ‘Accept’ button. Once the chef accepts the items for preparation, the customer cannot update those items. The tax will be added to the total bill and the new amount to be paid will be displayed at the end. Edit Modal allows to increase/decrease the quantity of the items or delete the items from the order.

The Edit modal opens up when the user clicks on the ‘Edit Items’ button.

Customers can see the delivery time for the first item to be served.

Before paying the bill, the customer can provide a tip. Customers can also provide feedback on the service and food.

Bill Page shows the amount to be paid, adds a tip, and allows the user to pay the amount.

Feedback form available to the customer.

Chef:

When the Chef logs in, he first selects the number of chefs in the kitchen at present. This will be used for the delivery estimation of an item.

The landing page of the chef

When the customer clicks the ‘Place Order button, the chef’s screen will get the list of items to be prepared. The order of items will be the order in which the order is placed. The chef’s screen displays the queue of items that were ordered. The chef accepts the order by clicking the ‘Accept’ button. From this moment, the customer cannot edit the accepted items.

Chef’s screen with some orders that have been accepted and are being prepared. Some orders waiting to be accepted.

When the item is cooked, he will update the item to a Ready state. At this time, this item will be added to the waiter’s screen. The chef can view the list of total items ordered in that restaurant.

Waiter:

This screen will be accessible to the waiter so that, she/he can change the status from occupied to ready once she/he finishes cleaning the table after the customer leaves. Also, she/he will be able to select the menu which is displayed to the next visiting customer.

Chef’s screen with some orders that have been accepted and are being prepared. Some orders waiting to be accepted.

This screen will display the list of items prepared by the chef and which are ready for pickup. Once the waiter picks up the item and serves it at the table, he/she will change the status of the item to Delivered using the ‘Delivered’ button in the Edit modal. Then the items will have the delivered e-stamp on them.

Waiter’s screen with the list of ready orders.

Items have the Delivered e-stamp on the items that have been delivered.

Once the customer finishes ordering, the waiter can mark the order as complete.

In the end, the waiter can proceed with payment from the customer and will mark the order as paid.

Front Desk Manager:

She/he can update the status of the tables in the restaurant. Also, she/he can assign an appropriate table to the customers depending on the availability and number of guests.

The table status lists for the restaurant

Restaurant Manager:

She/he can add, delete or modify the information about the food items. Also, she/he can modify the information about the restaurant.

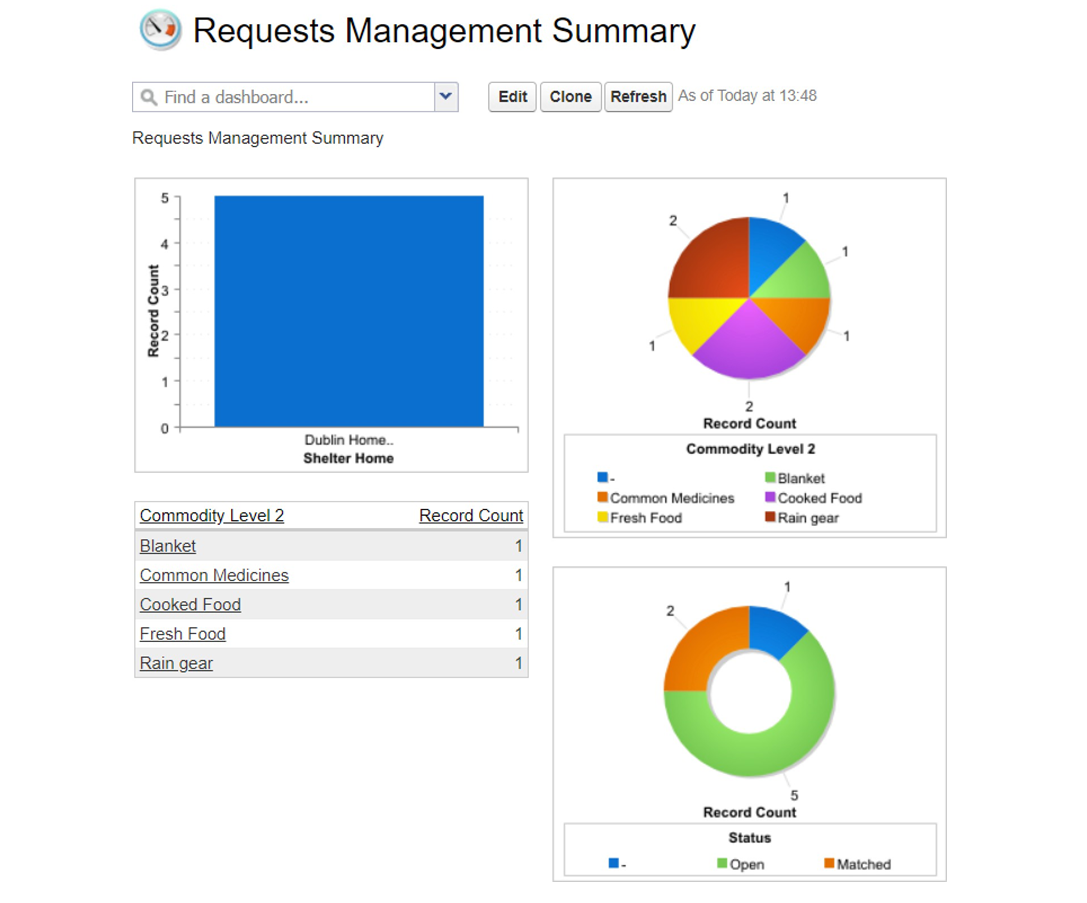
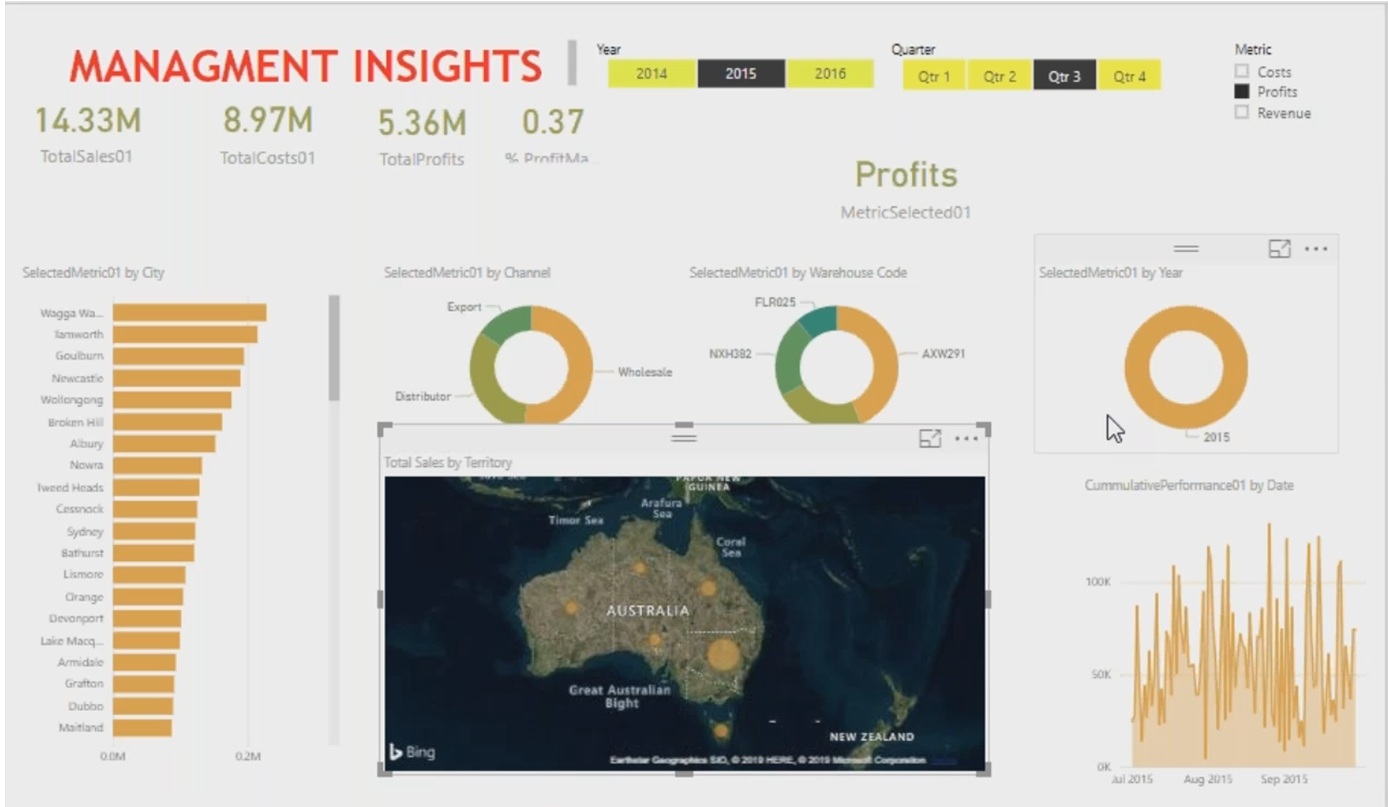
The restaurant Manager can view the weekly, monthly and annual sales for his/her outlet using the filters in the report section. This can be done using the Reports section where we have several reports to show the statistics pictorially.

Sales reports are visible to the people at the managerial level.

She/he can view the current inventory position of the restaurant. Also, the restaurant manager can update the inventory items. She/he can view the forecast of items in the inventory that are to be replenished.

Inventory chart for a quick update on the items in the repository.

Higher Manager:

She/he can view restaurant-wise weekly, monthly, quarterly and annual sales of the restaurant. Also, she/he can view the most popular items, average bills, and least popular items for further actions in menu management across the chain as well as per restaurant.

Screens

Table Screen

This is the first screen. The restaurant manager gets the list of table details with seats available and status in his restaurant. The guests will be allocated an appropriate table. When the table is selected, the status is changed to Occupied.

Controller Name: TableController

Page Name: TestTables

Menu Screen

This page displays the menu items. On the upper side, special offers are displayed. Menus are divided into 3 sections namely appetizers, entrees, and desserts. In each section, users can select vegetarian, non-vegetarian, and vegan items. By clicking on the item, the customer can view the food details. By pressing Add button, the item will be added to the cart.

The cart is displayed on the right side. The items in the cart can be modified before the place order button is clicked. The customer can see the total amount to be paid along with the taxes. When the item is delivered, the waiter will mark the item as delivered.

Controller Name: MenuItemListController

Page Name: Menu

Bill Screen

This page gets enabled when all the items in the order are delivered. This page will display the name, quantity, and amount for each item. The total will be displayed below it. Bill Page also has the option to provide tips. This will change the total amount. By clicking on the done button, the order is completed and the order will be closed.

If the customer wants to order more items, then the Back to cart button needs to be clicked. This will take the customer to the menu page.

At the end of the page, customers can give feedback;

Controller Name: Bill

Page Name: Bill

Chef Screen

This page displays the list of the ordered items by customers. The chef will click Accept button when he starts cooking the ordered item. After this moment, the customer cannot modify the item count that the chef has started preparing. When the item is ready, the chef will click on the Ready button. This will notify the waiter screen that the item is prepared. Now the waiter will serve the particular item.

Controller Name: ChefListController

Page Name: Chef_Pending_Orders

Waiter Screen

This page displays the list of food items that are ready to deliver. The waiter will pick up the items and deliver them to the table number specified with the item. He will click on the Pickup button when he takes the item.

Controller Name: WaiterListController

Page Name: WaiterPendingOrders

Shelter Homes and Donations Management Platform Project using Salesforce CRM Software

Business Background:

This Salesforce CRM Project is an Integrated Donations Management System Platform, which brings together Shelter Homes and their donors to a single platform.

The application makes it easier for shelter homes to access a large base of donors and provides the donors with a convenient way to identify the requirements of social establishments around them.

The application allows shelter homes and donors to create requests or pledges, respectively, and then view these entries and respond accordingly.

This provides an effective medium to match the requirements at the shelter homes to availability with the donors in the community.

We essentially aim to bring a market-place-based model to donations management at shelter homes.

Project Scope:

We have identified several gaps in the way shelter homes Donations Management System to collect donations:

1.     Difficulty in communicating immediate requirements to the society

2.     Time taken to request, and receive donations can be too high

3.     Donations may not reach where they are required the most immediately

4.     Donors may find it difficult to find an organization that could use their help

5.     Lack of a common platform to enable engagement between the shelter homes and the society

The application aims to address each of these issues systematically. Specific functionalities from within the Salesforce CRM have been utilized to build a system that caters to the requirements of both, donor and shelter home perspectives.

The Donations Management application needs to adhere to the following project goals:

1.     Users are able to log in as donors/shelter homes using web integration. Donors can register as either individuals or organizations

2.     Users are able to create pledges/requests for a specific category using web integration.

3.     Users are able to create pledges/requests in response to specific requests/pledges using web integration

4.     Allow the creation of campaigns to facilitate donations for a specific purpose (for ex, preparation for upcoming storm warnings, etc.)

5. System-generated reports help match pledges/requests based on selected categories, and their status is updated as such

6.     Analytical reports on activities on the platform

7.     Scheduled report provides frequent updates on open requests/pledges.

Limitations:

In the scenario where users do not provide an existing pledge/request name, the matching needs to be done by the administrator. This causes a manual intervention and may cause delays in the matching process

Reports from the application provide data on requests and pledges that are currently open. This information needs to be hosted and updated online separately. There is no convenient way to integrate this into the application

Future Scope:

Several functionalities can be added to the Donations Management application to enhance user experience, and achieve greater integration:

  • Integration with Payment Gateway to enable cash donations
  • Web API to integrate with business websites, helping create a corporate partnership
  • Mobile application
  • Automated alerts on matching pledges and alerts
  • Greater integration with the transportation process, once pledges and requests are matched
  • Categorize Donor organizations based on business type for focused engagement
  • Implement Salesforce Communities to promote greater engagement
  • Access to the Blackbaud Community
  • Include a wider range of non-profit organizations

Infrastructure:

  • Considering the upfront cost of hardware, it is better to go for cloud-based service than on-premise. Cloud-based services are scalable as per requirement.
  • Software as a Service is preferred over Platform as a Service as the former needs licensing cost, and time software updates.
  • A cloud-based Customer Relationship Management (CRM) service will be more beneficial as it reduces development and deployment time.
  • Salesforce applications have the feature of API integration that can be used later in other applications.
  • The Analytics service to create dashboards will help to get insights into different transactions

Business Requirement:

The below points describe the overall business objective the application aims to fulfill:

  • Shelter Homes and Donors can register on a common platform
  • Pledges and Requests can be created via web integration by donors and shelter homes respectively
  • Ability to create campaigns to aggregate donations and run separate donation programs for donors or shelter home
  • Pledges and Requests can be viewed and responded to. For example, donors can create pledges to fulfill a particular existing requirement
  • Reports providing regular updates on open pledges/requests
  • Perform analysis on platform usage, and identify major trends (top donors, etc.)

Process Flow:

  • The user enters the ‘Welcome Page’ and chooses Member Type as ‘Donor’ or ‘Shelter Home’
  • User redirected to log in page for Donor or Shelter Home as per selection in the first step. New users can navigate to the Registration Page and complete registration. Donors can register either as an organization or an individual
  • Donors are immediately notified by email post account registration. Shelter Homes are verified for authenticity, until then, the Shelter Home account status is ‘Pending’
  • Admin verifies the Shelter Home registration and updates status to ‘Approved’. Shelter Home contact is notified via email, and can now start using the account
  • User creates new Pledge / Request. A Request / Pledge name can be provided on the Pledge / Request, respectively, using a Lookup field provided in the creation form
  • A new request/pledge is created, and the status is updated as ‘Matched’, if Pledge Name / Request Name is provided by the user
  • A new request/pledge is created, and the status is updated as ‘Open’ if Pledge Name / Request Name is not provided by the user
  • Matches with new pledges/requests are identified based on reports generated in the application
  • The status of matched pledges/requests is updated by the system admin with Salesforce access. The corresponding Donor / Shelter Home is notified of the change in status of their pledge/request
  • The report is generated with the latest updated data on open requests/pledges
  • Use Salesforce Reporting functionalities to identify Top Donors by the number of pledges, Top shelters by the number of requests, Top categories for which requests are created to enable targeted campaigns, and Shelter Homes with a high amount of open requests, to enable personalized assistance if required. These reports are generated and described in the ‘Reporting and Dashboards’ section

Management Dashboards

Apart from these transactional reports, there are various Management Reports, arranged into Dashboards, to provide a summary of the application.

Dashboard 1: Overview

The Overview Dashboard contains various reports providing important metrics regarding application usage.

The reports help us analyze:

1.     Top donors based on the number of pledges created

2.     Top shelter homes based on the number of requests created

3.     Number of Shelter Homes with pending verification vs number of verified Shelter Homes

4.     Distribution of donors by Individual and Organization Donors

Such details are important for Customer Management and Donor Management. For example, top Donors can be identified and personally acknowledged, which will help retain them on the platform.

Dashboard 2: Pledge Overview

This dashboard provides a brief summary of pledges logged in the system. The above reports provide important data including:

1.     Number of Matched vs Open Pledges

2.     Trend of Pledges created in the current month

3.     Categories Distribution for Open Pledges

These reports help identify trends of the pledges created. A systematic decrease in pledges can be detected and followed up by the management.

Dashboard 3: Request Overview

The dashboard provides a detailed summary of the Requests created in the system. The reports provide information regarding:

1.       Category distribution of Open Requests

2.     Number of Matched vs Open Requests

3.     Number of Open Requests by Shelter Home

4.     Number of Open Requests for each Category

These reports help us analyze which categories are more widely requested by shelter homes. This can help the platform organize targeted campaigns to satisfy the requirements.

Online Job Portal using Cloud Tech Stack

Topic Name: Online Job Portal

Objective

The online job portal system is between job seekers and job providers (companies). The Job seeker can easily find and apply for a job by login into the system. The Employer or company can quickly get an expert employee from our job portal site by posting a job.

Create a web application for a company that job seekers will use to apply to the job requirements.

We will create a front end where users will view jobs.

There will be a login page that also has register functionality.

The user will be taken to the home page after login, where they can view different jobs.

Modules

  1. Job seeker/Employee
  • able to view register/login
  • Search jobs
  1. Employer-
  • Users- view all registered users
  • Jobs – add jobs based on category
  • Delete jobs
  • Edit jobs
  • View jobs

Cloud Tech Stack

AWS Elastic Beanstalk

AWS Aurora

AWS S3

AWS Cloud Watch

Covid-19 Testing Management System Python Project

Covid-19 Testing Management System is a small project developed using Python programming. Here are the application features below.

Project features:

• Adding new testing centers
• Search for available testing centers by locality
• Update and delete testing centers
• Show all testing centers by city, state
• Shows the number and type of testing kits available at each center.

Software to be used to develop this application:

• Python
• SQL for creating a database
• Library to interface between Python and SQL
• Either Django (to create a web app) or a GUI library to create the UI (not decided yet)

Implementation

1. Login page (This has a simple login prompt designed using a GUI library that asks for the user id and password.)
2. Menu:
a. Add a testing center
B. Delete testing center
C. Edit the number of testing kits available
D. Search for the testing center by district/city/state
E. Show all testing centers
3. Separate sections for:
a. Adding a new center
b. Deleting center
c. Updating center information
d. Searching for center
e. Nationwide data

Covid-19 Testing Management System can be developed by using PHP & MySQL Server with different functionalities below.

User Characteristics

The Covid 19 Testing Management system has 2 types of users they are Admin and user(patient)

General Constraints

The tools and technologies that are used to develop this project are:
The language used in this project is PHP5.6 and PHP7.x.
The database used in this project is MySQL 5.x.
The web browsers that are used in this project are Mozilla, Google Chrome, IE8, and OPERA.

Operational Scenarios

Scenario A:
How your application starts
Our application covid19 testing management system starts by login into the application, if the user is a new user, the user needs to register by providing the needed credentials.
New users need to provide testing information. A registered user needs to provide test information.

Scenario B:
Usage Scenarios like Customer Check-out
When a customer visits our application, he/she needs to log in by providing their credentials according to their role i.e., admin and user.
If the user is new, he needs to register if he is an old user, he can directly enter the login details and login directly.

Scenario C:
Database

The data that we are going to store in the database
1) Admin Login
Username
Password

2) New admin login
Admin name
Username
Password

3) User login
Username
Password

4) New user login
Name
Phone number
Username
Password

5) User Registration
Name
Current address
Gender
D.O.B
E-mail id
Phone number
Age
Aadhar card number

Classification of American Sign Language using online RESTful application

  • INTRODUCTION

This document report provides the desired layout to develop an online application service that accepts Human Skeletal key points of a sign video and returns the label of the sign in a JSON response. The document contains information about the extraction of key points from the videos using Tensor Flow’s Pose Net library and four different deep learning models that can classify American Sign Languages into six different signs. i.e {buy, fun, hope, really, communicate, mother}. Moreover, it also contains information about hosting services using flask API on ‘PythonAnywhere’ and steps involving handling HTTP requests coming from different users.

  • TECHNICAL APPROACH

Firstly, we have accumulated all the raw video data sets which have been recorded as a part of Assignment-1 and extracted frames of the particular timeline. Then, we used Tensor Flow’s Pose Net library in order to extract key points from the images, which are considerably used as training data for models. We have tried three different approaches to preprocess data and picked the one which gives the best accuracy for the trained models.

Approach-1: Scaled down raw data using the Universal Normalization technique and extracted a few features like- Standard Deviation, Moving Mean of Window size 5, Zero Crossing Rate, Dynamic Time Warping distance, and built feature matrix. Then we applied PCA on the feature matrix and using K-fold Cross-validation we trained four deep learning models named Convolutional Neural Network, K nearest neighbor, Support Vector Machine, and Random Forest. The average accuracy of the given models lay between 60-65%.

Approach- 2: As a part of the second approach, we expelled some features by observing the movement of each body part in videos for different signs and made a feature matrix of only important features. Then we apply Standard Scaler and Min Max Scaler in order to normalize data and trained our models using the first approach.

Somehow, we were able to increase the average accuracy of the models by 10%.

Approach -3: We have observed in the second approach that, our model is only considering the static coordinates of each body part, so we subtracted each coordinate of different body parts from the static body parts and processed the data in the same manner. So, by doing this approach we got our highest average accuracy which lies between 85% to 90%. 

  • INITIAL FEATURE EXTRACTION 
  1. Zero Crossing Rate
  2. Moving Average Window
  • Standard Deviation
  1. Dynamic Time Warping Distance.

Zero Crossing Rate: The zero crossing rate is the rate of sign- changes along with a signal, i.e the rate at which the signal changes from positive to zero to negative or vice versa. Zero Crossing Rate can be used as a primitive pitch detection algorithm for signal processing.

Moving Average Window: Moving Average is optimal for reducing random noise while retaining a sharp step response. This makes it the premier filter for the time domain encoded signals

Standard Deviation: The standard deviation is a measure of how far the signal fluctuates from the mean. It also depicts how data disperse near the mean of particular data series.

Dynamic Time Warping Distance: DTW measures the similarity between two temporal series data. Any linear sequence data can be analyzed with DTW, it aims at aligning two sequences of feature vectors by warping the time axis iteratively until an optimal match between the two sequences is found.

Feature Engineering:

We have expelled a few features by observing the movement of each body part for different signs and made a feature matrix with only important features. Below is the list of features that we considered for training models.

[“nose_x”, “nose_y”, “leftShoulder_x”, “leftShoulder_y”, “rightShoulder_x”, “rightShoulder_y”,”leftElbow_x”, “leftElbow_y”, “rightElbow_x”, “rightElbow_y”, “leftWrist_x”, “leftWrist_y”,      “rightWrist_x”, “rightWrist_y”]

Here, we observed that the coordinates value of each body part shows a static position for a given time, so we have subtracted each body part’s coordinates value from the corresponding static body part’s coordinates. Here, we have considered “nose”  as a static body part and subtracted each body part with corresponding X and Y coordinates.

The above-mentioned approach would become simpler for the models to understand the movement of each body part, as we have a relative position for each body part, the model can easily predict certain gestures by examining the positive or negative sides of coordinates.

  • MODELS USED:
  1. K nearest neighbor
  2. Convolution Neural Network
  • Support Vector Machine
  1. Random Forest

K Nearest Neighbor: The K Nearest Neighbor classifier is one of the most simple machine learning algorithms that simply relies on the distance feature vectors. It classifies unknown data by finding the most common classes among k nearest examples. The majority vote of the class label is assigned to unknown data. As KNN is a lazy learning algorithm, it works more efficiently when our dataset has been distributed in multi classes.

Support Vector Machine: The core idea of Support Vector Machine is to find a hyperplane that separates two sets of objects having different classes. It uses a technique called kernel trick to transform data and based on this transformation it finds an optimal boundary. It is considered one of the most robust and accurate algorithms among other classifiers.

Random Forest: Random Forest is an ensemble classifier; it takes multiple individual models and combined them into a more powerful aggregate model. So, let’s say we have different individual models, then there might be the case that they work efficiently because some part of the data set would be overfitted to the model. So by combining them, we can reduce the chances of error. Random forest built upon by aggregating n possible decision trees which might be generated by randomly picking data set row as root. So, as the dataset would be increasing, the possibilities of generating random decision trees would also increase and aggregating different decision tree models lead to an increase in the efficiency of the aggregated model, too.

REFERENCES:

Drowsiness Detection of a Cab Driver Python Project

  • In the present situation world, Accidents are part of life. On an average of 1214 road accidents in India only. One of the main reasons for road accidents is being drowsy during driving.
  • The application Drowsiness Detection of a Cab Driver helps the manager of the company get a notification that the driver is drowsy and an alarm rings in the car to alert the driver.

USAGE:

>    python detect_drowsiness.py –shape-predictor shape_predictor_68_face_landmarks.dat –alarm alarm.wav

Use the above command to run the application

This Drowsiness Detection of A Cab Driver application needs the following modules: –

MODULE NAME:  scipy

COMMAND USED FOR INSTALLING: conda install -c anaconda scipy

MODULE NAME: imutils

COMMAND USED FOR INSTALLING: conda install -c anaconda imutils

MODULE NAME: threading

COMMAND USED FOR INSTALLING: conda install -c anaconda threading

MODULE NAME: numpy

COMMAND USED FOR INSTALLING: conda install -c anaconda numpy

MODULE NAME: playsound

COMMAND USED FOR INSTALLING: conda install -c anaconda playsound

MODULE NAME: argparse

COMMAND USED FOR INSTALLING: conda install -c anaconda argparse

MODULE NAME: time

COMMAND USED FOR INSTALLING: conda install -c anaconda time

MODULE NAME: cv2

COMMAND USED FOR INSTALLING: conda install -c anaconda cv2

MODULE NAME: dlib

COMMAND USED FOR INSTALLING: It should be installed in the virtual environment the command is: conda install -c anaconda dlib

IN THE ABOVE-MENTIONED MODULES MOST OF THEM WILL BE GIVEN DEFAULT

TO CHECK THE MODULES THE COMMAND IS conda list

Download the complete project source code

Product Stores & Inventory Management Project

Existing System

Following are the S/W for Procurement Process and Managing the database for all the projects of Programme ANSP from Demand – SO – Payments – Stores Inventory.

Challenges: Following are the Challenges in using the above-mentioned Inventory Management S/W

  • Multiple Client–Server Applications for data capturing.
  • Systems are very old and hence they are not able to cope with the latest S/W and H/W.
  • No communication between the applications.
  • No linkage between the projects, every project has a separate schema and instance.
  • Few processes cannot be automated.
  • The database may not be in normalized form.
  • Database structures may not be uniform across systems.
  • Effort duplication might be happening for data entry and reporting.
  • Software Maintenance may be a major concern.
  • No online approvals.

Proposed System

To Overcome the above-mentioned problems, an attempt is made to develop a Web-based product Stores & Inventory Management Project which is centralized, fully integrated having/ all the required functionalities of the existing system. Product Stores & Inventory Management Project will have FIVE major modules, Master, User Management, Procurement and Store Inventory, Payments

General Features 

  • A centralized, fully integrated System that can integrate all required functionalities of existing systems.
  • Should be able to handle any number of Projects without having any additional instances.
  • Organizational Changes should not impact the system.
  • Optimization in business process Automation.
  • Leverage the advantage of new technologies like Java, Spring, Hibernate, and Oracle RDBMS 11g.
  • Multiple users would access this application software with proper Authentication.
  • The proposed system should work both on LAN and WAN (TBD Internet), is a web-based application, and is easy to configure. This system would be developed in a user-friendly way.
  • Business Rule and Workflow for optimizing resources and reduction in Data entry redundancy.
  • Online approval can be done based on their roles and their responsibility.

Functionality Features 

  • Reports(Item/BOM/System/sub System/Article wise summary, Lifted Items, Shortage Lists, Expired items list, and Final Built-in Report), Various reports to be generated throughout the Procurement, Inventory  and other stages such as Proposal, Sanctions, Demands, Enquiry, Inventory, IR and Voucher Gate Passes 

Transaction logs 

  • Transaction log shall keep track of data items added, changed, or deleted.

For records that are added, the data items logged shall be:

  • User ID of the user who activated the functions.
  • Function name
  • Date/Time of the action
  • Data items added

For records that are modified, the data items logged shall be:

  • User ID of the user who activated the change
  • Function name
  • Data items after and before the change of action

For records that are deleted, the data items logged shall be:

  • User ID of the user who activated the function
  • Function name
  • Date/time of the action
  • The add/change/delete functions which shall be logged in the transaction log shall be a different functional requirement given in this document.

Access Control 

  • A valid user ID and password should be entered in order to access the Product Stores & Inventory Management application. Only the project administrator can create or disable user accounts.
  • A timeout to log out feature would be set for non-active sessions or sessions idle beyond a certain time period. Proper session management for the application would be set so those non-active sessions would be automatically logged out.

System Overview

The purpose of this document is to present a detailed description of the Web Publishing System of the “Product Stores & Inventory Management Project” for ANSP (Advanced Naval Systems Program). 

System Architecture

  1. Layered Approach

Product Stores & Inventory Management Project application would be developed in a layered approach. This would enable the team to work on different components independently and also for faster development. It increases flexibility, maintainability, and scalability. It helps in configuring different levels of security.  It also helps in testing components independently.

  • The user interface layer is which all end users would view. All UI components are created and integrated with the business layer.
  • In the business/ service layer, business objects help us in defining entities. Using these business objects, business logic is developed and attached to services. These services are exposed through an application programming interface (API).
  • The data access layer would connect to the database by using hibernate. Hibernate is a high-performance object/ relational persistence and query service. It not only takes care of the mapping from java classes to database tables and from java data types to SQL data types but also provides data query and retrieval facilities.
  • The repository includes a database and file system. The file system would include all the attachments uploaded through the application.
  • Audit log, security & external application integration would include auditing, and tracking of all actions and activities done by users. All integrations like SMS, email, and any hardware integrations are done in this layer.
  1. Detailed Application Layer Architecture

This Inventory Management application would be developed in three-tier architecture i.e.  Client, application and data tier. In the client tier, all end users can access by using a web browser and interact with the Product Stores & Inventory Management Project. UI components would include JSP, CSS, java scripts, and JSON. In the application tier, the application design would be included with presentation, business logic, and data access layers. As discussed earlier, these layers would help applications for faster accessibility and faster development. Architectural styles would include REST i.e. representational state transfer and architectural pattern would be MVC (Model View Controller). In the data tier, services would get the data from the Oracle database and present it in the presentation layer so that the end user can view and take necessary actions.

Functional Modules

The Inventory Management Project contains the following Main Modules

  • Stores & Inventory Management

Store inventory management is a module that enables the maintenance of accurate inventory of its products. The following are the modules.

  • Issue of items
  • FIM Issue using Gatepass

Store Inventory Module:

The Store Inventory would deal with functions like receiving items into inventory and issuing items from the inventory to the requested user based on approval. The system should generate vouchers as per the store’s format for both issues and receiving. Procurement and Store Inventory uses well-designed Web Forms for specific actions required by the users.

Operating Environment

This product will be developed mainly using open source technologies like apache, Java, Spring, Hibernate, Ext-JS, and Windows Operating System for developing this product.

Server Operating System

Ubuntu Linux or any other flavor of Linux

Language / Tools

Java, J2EE, Hibernate, ExtJS

Client O/s

Windows 7 and Above

Database

Oracle 11g

Application Server

Jboss/Apache Tomcat

Web Server

Apache2

Browser Support

Chrome, Mozilla Firefox 10+, Internet Explorer 9.0 and above

Server Hardware requirements:

Processor

Intel Xeon Processor 2.1 GHz

Memory (RAM)

16 GB or higher

Storage Capacity (HDD)

Minimum 500 GB

Port Speed:

10 Mbps Public & Private Networks

System Features & Requirements

Capability Requirements

This subsection provides a high-level overview of the major capabilities of the Project.

Users Capabilities

The System will provide the following capabilities to users:

  • The Product Stores & Inventory Management Project will enable all authorized users to:
  • Provision to Raise Material Gate Pass

External Interface Requirements

User Interfaces

The user would then enter the required data for processing and press the Save or Submit button, after which the processing would be done and the user would be returned to the main page.

The user would then be able to use the different functionalities of the Product Stores & Inventory Management Project by clicking on various links that are provided on each page.

There would also be a Logoff button which would help the user to end his session with the application and he will be transferred back to the login screen.

Functional Requirement

Login

Description & Priority

This feature will be used to LOG IN to the application (only permitted users can use the PMS). It is done in order to prevent any misuse of PMS

Login users:

User, HOD, PGD, PD, Admin, PJB, PMB (Approval Members), and Office users/Clerks can log in with their assigned User names and password.

Stimulus / Response Sequence

When the user gives the correct username and password combination, he/she is transferred to the main screen or the PMS main page.

Functional Requirements

Purpose

To check the credibility of a user and to prevent any misuse of the product.

Inputs

The input will be a username, password combination, and project associated with the program. 

A user can have multiple roles and a role can have multiple features. The change password feature should be with admin only; if the user wants to have a change password feature user has to enter a security question that is provided by the user at the time of user registration.

Output

The user will be transferred to the PMS main page on successful validation and will be alerted if the validation is unsuccessful.

Validations:

Login Credentials.

  • After login user access only assigned project-specific and assigned role-specific data. Here users can be assigned multiple roles and multiple projects.
  • There will be one default project and default role configured.

PMS Login Use Case

PMS Login Use Case

MATERIAL GATE PASS

Free issue material is the item that is issued to the respective supplier in order to develop/manufacture the required item.

FIM has been categorized into two types.

  • Returnable
  • Non-Returnable

Generation of returnable and non-returnable gate passes.

  • Before gate pass generation user has to raise the gate pass requisition in a specified format with an auto-generated gate pass requisition number.
  • If the type of gate pass is returnable then PDC (Proposed Date of Completion) has to be mentioned (Mandatory).
  • If the gate pass purpose is FIM then QA/QC approval is required.
  • After the gate pass requisition is approved the generation of the gate pass is done by the admin.
  • The below Screen is for requisition for gate passes. To generate a gate pass, the admin has to select the gate pass requisition number on the gate pass generation page and get the gate pass requisition details with some entry fields like packed by & date, supervised by, SOB Number, and date.
  • After taking the concerned officer’s approval gate pass with items went to the security office for the check, if approved out of control number.

Gate Pass System

  • For the issue of an item/ BOM for an outside organization or supplier then the issue has been done by raising gate pass requisition.
  • Gate Pass requisition of two types 1) returnable and 2) non-returnable.
  • After gate pass requisition approval takes place and approval has been done the store admin raises the gate pass with item information.
  • Sends the item with gate pass to the security to out that item.
  • For gate passes also concerned officer’s approvals are mandatory

Gate pass requisition

Returnable:

In the case of items issued on returnable gate passes, the cost of FIM will not be added to items received in the supply order.

  • Requisition gate pass raised by user &approved by project director
  • Gate pass raised by store member/ issued by store member which required authorized officer’s approval.
    • Issue of returnable gate pass max period allowable is 11 months (In PDC, it has to be mentioned).
    • The system has to prompt/alert two weeks before the expiry of the above period in returnable gate pass.
  • FIM BG (bank guarantee) by vendor needs to do for a specific time and date.

Provision for a check box indicating the required FIM BG amount is available in the preform

Non-Returnable

Non-returnable gate pass would be generated for the following:

  • Transfer to other work centers (other labs/inventory) on a permanent basis

– FIM BG (bank guarantee) by vendor needs to do for a specific time and date.

– External issue voucher prepared by the stores with a gate pass

– Inclusion of FIM cost lot-wise/Total cost of supply item when delivery takes place.

– External issue voucher with a gate pass both need to approve

  • Requisition gate pass raised by user & project director
  • Gate pass raised by store admin which required authorized officer’s approval.
  • External issue vouchers are prepared for all items irrespective of their destiny.

– Deduction from stores will be done after approval of external vouchers from respective users and authorities and receipt of Voucher (Acknowledgement) details from another unit.

– FIM gate pass going to labs conversion issue voucher prepared for items flight hardware.

– Nonflight items FIM to other labs external voucher, transfer voucher, and gate pass issued

– Certified received voucher (CRV) from the other inventory once received, the external voucher is prepared.

Note: All items go through returnable/non-returnable gate passes only.

In case a vendor brings an item for entry into the project, a pass is prepared by MMG and sent to Security online to allow the firm inside.

In order to deny permission for entry to those items that were sent on returnable gate passes, it is suggested that a format/ screen be provided for the user to request for the issue of pass by MMG. In that format, the User has to state whether the items being brought inside by the vendor have gone out on returnable gate pass or are being supplied on S.O He has to give reference to S.O or returnable gate pass.

Where a gate pass is prepared whether returnable or Non-returnable, periodically the control no and date issued by Security is to be entered against the gate pass. In case of returnable gate pass corresponding control no and dates are also to be recorded.

Gate pass generation

  • After gate pass requisition approvals, store admin generates gate pass to out the items which are issued to outside organizations/ suppliers as requested item/ BOM (FIM) wise.
  • By taking concerned authority approvals stores admin sends the same to security to out the item/ BOM.

Generation of returnable and non-returnable gate passes.

  • Before gate pass generation user has to raise gate pass requisition in a specified format.
  • If the type of gate pass is returnable then PDC (Proposed Date of Completion) has to be mentioned (Mandatory).
  • If the gate pass purpose is FIM then QA/QC approval is required.
  • After the gate pass requisition is approved the generation of the gate pass is done by store members.
  • The below Screen is for requisition for gate passes. To generate a gate pass, the admin has to select the gate pass requisition number on the gate pass generation page and get the gate pass requisition details with some entry fields like packed by & date, supervised by, SOB Number, and date.
  • After taking the concerned officer’s approval gate pass with items went to the security office for the check, if approved out of control number.

Gate Pass Requisition Screen for Returnable/ Non-Returnable: 

Gate Pass Requisition User Interface

TBL_GATEPAS_REQUISTITION

TBL_GATEPASS_ITEMS

IT Banking Portal Student Java Project Using Eclipse

EXECUTIVE SUMMARY OF THE PROJECT

Synopsis 

The mini-project made by us is basically a demonstration of the banking systems around the world on a very basic scale, in which we have created a GUI (Graphic User Interface) using the eclipse platform of JAVA and using the file management systems in JAVA. Basically, we have provided an interface to add, delete and view the different many accountants of a particular branch of a bank and also to add, delete and view the different bank holders and also store their account numbers, contact numbers, and salaries in the file, just to use whenever required. We have used the file management system in JAVA to store the details of all the accountants and the account holders.

Introduction 

The application that is the essence of the project works by defining various classes that even have further subclasses so as to modularize the final code. The code is written in a neat fashion with appropriate documentation. It provides a smooth, unfaltering user experience so as to facilitate its use among all age groups.

The use of exception handling in Java is implemented so as to prevent the user from getting stuck in a process and understanding the use of the application in a more suitable manner. It eases the reading and understanding of naive runtime errors generated. The use of the multithreading concept in Java lets us use multiple threads at a single time and also lets us do multiple tasks simultaneously which is required in the banking system.

Problem Statement 

The motivation behind the project was the lack of a simple well-written application to access and modify the details of the bank accountants of a particular branch and the bank account holders at the same time. It gave us enough motivation to make a GUI-based application to solve the same. In a world like this, can a whole lot of the population afford to waste the time looking for the details in the hard-copied registers and looking for all the accountants and the account holders when they can be easily maintained as a simple application?

Objective 

The main objective of the project makes the user to access the details of all the bank accountant’s bank account holders. It also gives the accountant the authority to delete, and modify the details of the account holders but the reverse is not possible

because that’s the hierarchy in a banking system works in that way. The aim is to give the accountant entire power virtually on the application. With our application, we have achieved just that. The application could have been designed in many different ways, but we have produced a solution of application that minimizes time complexity as well as space complexity by using Encapsulation, Polymorphism, Inheritance, and data abstraction. Along with these, Interfaces and various access modifiers have been implemented so as to maintain privacy and definition of access in different blocks Of code. The use of exception handling lets the user know exactly what went wrong.

METHOD

The application works by reading all the accountants and the account holders from a different file, which can be updated by the proprietor of the application, and also the same power is given to the admin of the bank. The file has the information stored in a particular format, which is decoded by the string reader functions in the code. Each time we enter or want output from the file we have to read this string reader function which is an in-built function of java and can be directly used just by importing the required files.

If there exists an object for the particular accountant or the account holder already, then that object is accessed, instead of creating a new one. If an object that is not available in the file is to be accessed then that object needs to be created and then accessed hence access to that object is not allowed and hence access is denied. We have to make sure that the object we want to access is present in the file system otherwise we have to create an object. The usage of various JFrames also enables us to increase our scope and work beyond the limitations of java by using the GUI effectively to give users an attractive interface to work with and get the work done.

SYSTEM REQUIREMENTS:-

  • Eclipse platform for JAVA GUI (Graphic User Interface)
  • JDK(Java Development Kit)
  • Windows Operating System

WORKS DONE:- (SCREENSHOT PF OUTPUT AND EXPLANATION)

  1. Main Page:–

This is the main frame that will be displayed as soon as our project gets executed. This is also the first page and the directive page as it directs us either to the admin section or to the accountant section. It consists of two buttons ADMIN LOGIN AND ACCOUNTANT LOGIN.

  1. Admin login page:–

This is the page that gets displayed as soon as the user clicks on the admin login button.

It consists of 2 labels namely enter a name, enter a password, one button, one text field, and one password field to get the password. To hide the password we have here used the echo Code property of the password field to encrypt it.

  1. Login Failed:–

This page gets displayed as soon as the user gets the name and the password on the frame admin login form but the dialog box with the message “Sorry, Username or Password Error” only when either the password or the name entered is incorrect.

4. Admin login Section:–

This frame gets displayed when the user enters the correct name and password. It has 4 different buttons which will direct to the things written on them. Only the ADMIN can enter the details of the Accountant and no one else. It consists of the addition, viewing, and removal of the accountant.

5. Add Accountant Page:–

This frame appears when the Accountant login button has been selected and the name and password entered are correct. This frame consists of the heading Add Accountant and it consists of 6 labels and 6 text fields and 2 buttons. This

6. Accountant Added Successfully:–

This frame appears when an accountant is added successfully.

This frame comes under the admin section. It consists of a dialog box that is used to make a JOptionPane.showMessageDialog() function.

  1. Database of all accountants:–

This is the database frame of all accountants under the institution. This contains various information about the accountants.

  1. Deleting an accountant:–

This frame comes under the admin section.

This frame does the job of deleting an accountant.

This is in the control of the admin whether to delete or not.

  1. Record Deleted Successfully:–

This frame comes when the record is deleted.

This frame confirms that the record is deleted successfully.

  1. Accountant Login Form:–

This frame can be chosen from the main frame of the project.

In this framed name and password of an accountant has to be given and if it is correct then the accountant section frame pops up.

  1. Accountant Section:–

This frame comes under the accountant’s control.

In this Frame, the accountant can add and view users.

  1. Add Account section:–

This frame appears when the button to add an account is hit in the Accountant section.

This frame saves the user’s various details in the database.

  1. Account Added Successfully:–

This frame confirms that the user is added successfully. This frame comes under the accountant section.

  1. Database of users:–

This is the database of users.

This comes under the accountant view section.

FUTURE WORKS:-

  • Since the project was made on a very basic level the obvious future work for the project would be to inculcate into it more complexities of the real-life kind of banking system. Since the project we made was only for the students of the branch IT in its future work we can inculcate more branches
  • Another future work that might sound interesting is to provide a server to it and make it using a database like MySQL(My Structured Query Language) which is a database used often with Java to store the details and the contents into it. It will be relatively easier for both the user as well as the programmer to use MySQL instead of the file management system, this is because in the file management system, we have to distinctly code to read in a string or anything else but when using MySQL we can directly use the add, delete and modify inbuilt functions of the MySQL database system and connect it to the Java program through server and then take in the command from the user in java and then pass on the same command to MySQL. Java and MySQL can be connected to each other through database connectivity which basically connects them through

RESULT AND DISCUSSION:-

The main result of the project is that we are now able to create a banking interface within a branch and between the accountants and the bank account holders. It can also be used to display the details of the users/bank account holders if we want to know something about them as and when we require it.

The usage of JFrame also enables a good graphical user interface making the banking system look more attractive and hence more appealing to the user. Since we have used many components on the JFrame like the text fields, password fields, radio buttons, and other buttons. All the components within them contain a lot of properties that can further be used to make it more attractive and more user friendly and also more encrypted in a way hence ensuring the data encryption in the Java program.

CONCLUSION:-

This was our project ever involving the connectivity of a language with the file management systems. This surely taught us a lot of things like how to store the details and how to look for the details in the backup database and how to create a database and how to back up our data regularly. Through this project, we ended up making an IT portal that has important significance and is very essential to us all. Through this project, we have gathered more knowledge about java, eclipse, and file systems in java. We also got to know a bit more about databases and how we use them.

This project also taught us how to work in a team and taught us various leadership skills and how to coordinate in a team and get the work done.

Power BI Management Insights Dashboard Assignment

Management Insights Dashboard Assignment

 The leaders of a company want to develop Comparing Dashboards for the management of the organization. These dashboards will provide a transparent and dynamic representation of the organization’s most important metrics, such as Revenue, Costs, and Profits, which can then be used for additional analysis or decision-making.

Data Model:

The management team at the company supplies the information in the excel file titled “Management_Insights_DataModel.xlsx” and the corresponding data diagram can be viewed below. This Excel spreadsheet includes separate sheets for “Sales Data”, “Customer Data”, “Products Data”, and “Regions” data.

Both the “Sales Data” table and the “Customer Data” table can be connected via the “Customer Name Index” column and the “Customer Index” column, respectively.

Both the “Sales Data” table and the “Products Data” table can be connected via the “Product Description Index” column and the “Index” column, respectively.

Both the “Sales Data” table and the “Regions” table can be connected via the “Product Description Index” column and the “Index” column, respectively.

Both the “Sales Data” table and the “Dates” table can be connected via the “OrderDate” column and the “Date” column, respectively.

Business Requirement:

The executives of a company have requested that we develop an interactive and lively dashboard similar to the one seen below.

When the Year / Quarter of the selected Key Metric is clicked, the relevant data visualization should load up in order to facilitate improved decision-making.

Example Report:


Functional Requirements:

 Data Gathering / Requirement:

Prepare a report using a variety of visuals in order to display management insights on a single page as effectively as possible. Feel free to use your imagination to create the most accurate representation of the facts you have.

  1. Sales Data
  2. Customer Data
  3. Product Data
  4. Regions
  5. Dates

Task 1.1

Create a mechanism that will load all of the tables from the “Management_Insights_DataModel.xlsx” into a respective table.

 Task 1.2

In order to give the data segregation, you should first create a new table called “Metric Selection” and then fill in the information that is listed below.

Table Name: Metric Selection

Metric

Metric Index

Revenue

1

Costs

2

Profits

3

 2. Data Modeling:

Task 2.1

Establish the relationships between all of the tables that were uploaded from Excel as defined in the data model.

  1. DAX Calculations & Visualizations :

 Task 3.1

 Total Sales: Calculate a new measure in the “Sales Data” table, by summing the “Total Revenue” column and displaying it on the Power BI Visual “Card” on the Report.

Total Cost: Calculate a new measure in the “Sales Data” table, by multiplying the “Order Quantity” with “Total Unit Cost” and displaying it on the Power BI Visual “Card” on the Report.

Total Profits: Calculate a new measure in the “Sales Data” table, by using the previously created measures Total Revenue – Total Cost and display it on the Power BI Visual “Card” on the Report.

Profit Margin%: Calculate a new measure in the “Sales Data” table, by using the previously created measures that “Total Profit” % “Total Sales” and display it on the Power BI Visual “Card” on the Report.

Task 3.2

Create a new Power BI Visual Slicer – “Year” on the report using the Year column from “Dates” Tables to select year information. Connect all of the previously constructed “Total Sales,” “Total Cost,” and “Total Profits,” as well as the “Profit Margin%,” to this “Year” selection. Changing the criteria in the selection of this Metric Values, the corresponding information should be displayed.

Power BI Visual Slicer – “Year”, should show the buttons for the user to selection

Button background color should be changed on Click of a button

Task 3.3

Create a new Power BI Visual Slicer – “Quarter” on the report using the Quarter column from “Dates” Tables to select Quarter information. Connect all of the previously constructed “Total Sales,” “Total Cost,” and “Total Profits,” as well as the “Profit Margin%,” to this “Year” selection. Changing the criteria in the selection of this Metric Values, the corresponding information should be displayed.

Power BI Visual Slicer – “Quarter”, should show the buttons for the user to selection

Button background color should be changed on Click of a button

Task 3.5

 Create a new Measure “MetricSelection” on the “Metric Selection” table. The “Metric Selection” table should be displayed on the Power BI Visual “Slicer” “Metric” on the report.

Power BI Visual Slicer – “Metric”, should show the check box for the user to select

Task 3.6

Create a new Power BI Visual “Clustered Bar Chart” on the report using city-wise data from sales data tables and connect this with “Metric”, “Year” & “Quarter” report components. Changing the criteria in the selection of this Metric/Year/Quarter the corresponding information should be displayed.

X-Axis – City

Y Axis – Selected Metric

Task 3.7

Create a new Power BI Visual “Donut Chart” on the report using “Channel” wise data from sales data tables and connect this with “Metric”, “Year” & “Quarter” report components. Changing the criteria in the selection of this Metric/Year/Quarter the corresponding information should be displayed.

Legend – Channel

Value – Selected Metric

Task 3.8

Create new Power BI Visual “Donut Chart” on the report using “Warehouse Code” wise data from sales data tables and connect this with “Metric”, “Year” & “Quarter” report components. Changing the criteria in the selection of this Metric/Year/Quarter the corresponding information should be displayed.

Legend – Warehouse Code

Value – Selected Metric

Task 3.8

Create a new Power BI Visual “Donut Chart” on the report using “Date” Column data from Dates data tables and connect this with “Metric”, “Year” & “Quarter” report components. Changing the criteria in the selection of this Metric/Year/Quarter the corresponding information should be displayed.

Legend – Date

Value – Selected Metric

Task 3.9

Create a new Measure “CumulativePerformance” on Selected Metric (previously calculated) on sales Data tables and display the results in Power BI Visual “Area Chart”

X Axis – Date

Y Axis – CumulativePerformance

Task 3.10

Create a new Power BI Visual “MAP” on the report with data from the “Territory” column of the Regions tables, and then connect this to the “Sales Data” table in order to present the sales broken down by territory when the user selects an area on the MAP.