
Abstract:
This project can implement features like: The first feature is “Graph”, it shows the graphical representation of the student’s performance (attendance and aggregate). The second feature is the “Projects”, here all the project titles with description are stored in the database so that it will be helpful to our juniors and it also helps to know if the new projects are colliding with existing.
Existing System:
- In our college, the projects are stored in the CDs so there is a problem in accessing.
- In our college website, the student’s performance is not shown clearly.
Proposed System:
In our application, we are introducing “Graphs” and “Projects”.
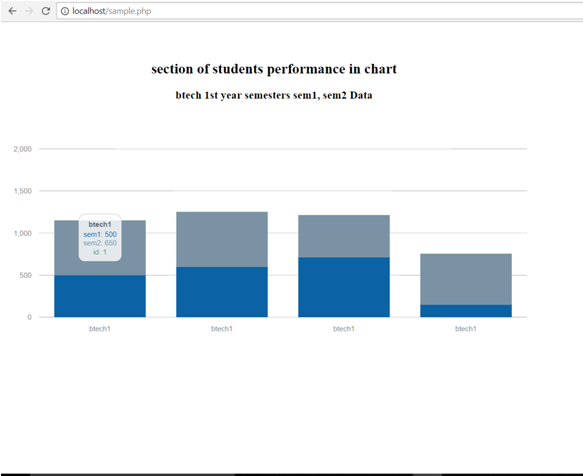
Graphs – Here the student’s performance(like attendance, marks) is shown in charts. Where bar graphs are aggregate in semester wise and curve graph for attendance.
Projects – Here all the projects are stored, we create a hyperlink of all the project titles when we click on it the page will be redirected to the project description. There is a search bar where we can search any project by the project’s name or by guide’s name or by the year and duplication of projects can be eliminated.
Modules of Project
Modules Description
Back End: Database, which stores the student details and list of projects with their description.
Front End: User interface, where the client can view charts and project lists.
Middle End: It is the logic or Java code which retrieves data from the database(backend) and display it in the form of charts and it also displays the project lists so that it is easy to access rather than from the CDs.
Methodology/Algorithm/tools
- We used MySQL for storing student information and list of projects with descriptions.
- Java language for coding the logic and HTML & CSS for designing the page.
- Morris.js chart, JChart are the packages helpful for projecting the charts.
- Every project title is hyperlinked to its description.
UML Diagrams:
Use Case Diagram:
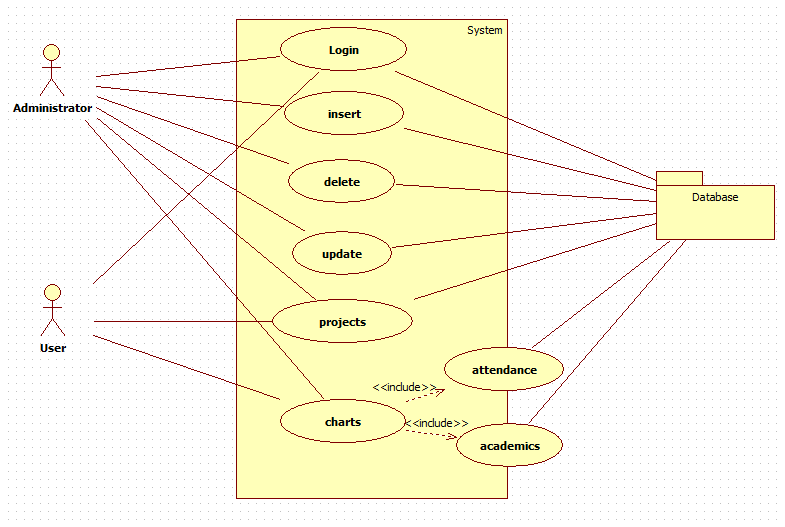
Class Diagram:
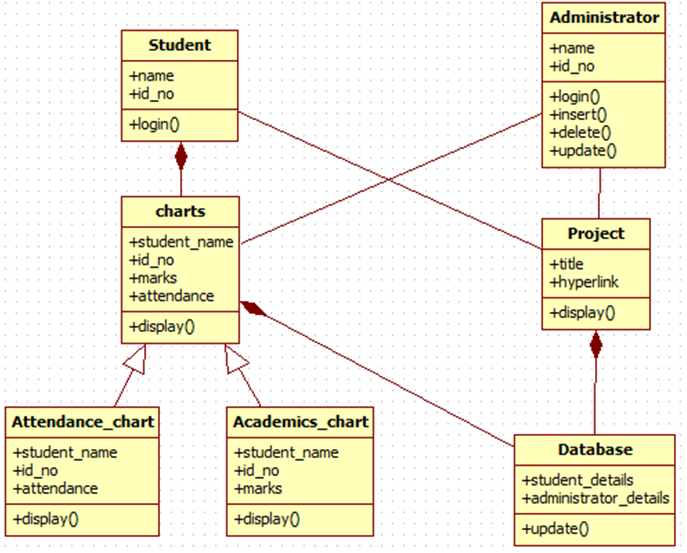
Sequence Diagram:
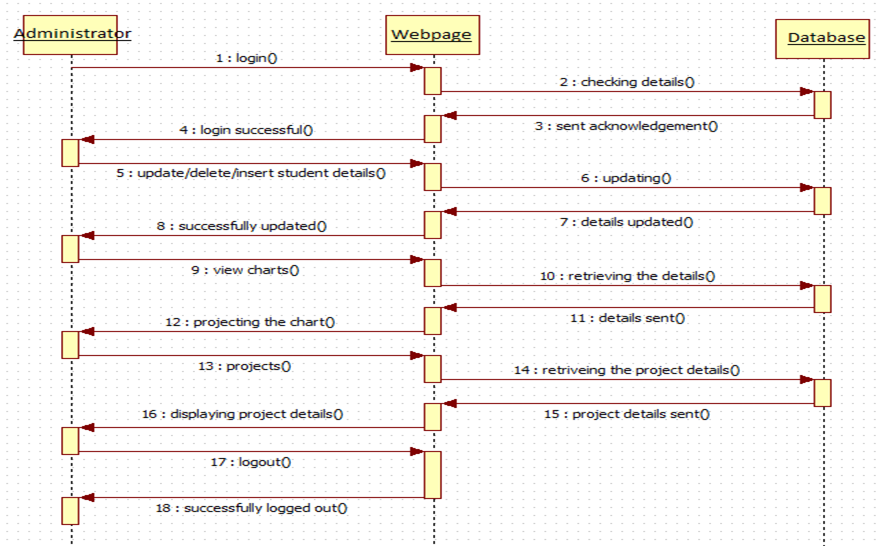
Activity Diagram:
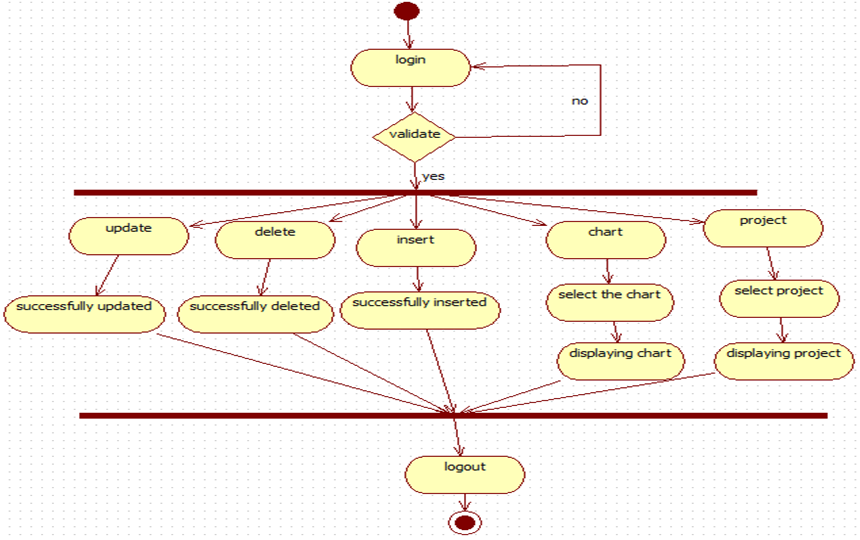
Screen Shots:
Dataset
Our data set includes student’s details of our college like every semester marks, attendance percentage and details of all the projects done by students of CSE.
Conclusion
In this project, we showed the students performance in the form of charts so that it is easy to know the student’s overall performance.
This project also consists the details of all the projects done by the CSE students in our college.
project is super
can i get the code for it please…
I want this projects source code can I get it urgent.
Send me source code
Me too want source code for the project..pls send me immediately
ooh..Is this really worked.great.
can u please suggest me a mini project that is effective today in the real world.
Can you provide me the project source code please?
send me the source code of this please?
i need the source code bro can u send me
Can u please provide me the source code please
i need the project source code,can you send me please
please send me the source code as soon as possible
Please send the source code for this project
please send me the source code
Please send this project report and source code