Results are obtained after running the simulation for 5 minutes and the actual methodology to design the simulation and the simulation procedure followed is explained in the previous chapters. Three scenarios are created in this simulation procedure and the fist scenario has normal configuration aspects, second scenario has two more attack nodes where the parameters of the routing protocols are changes. Now the third scenario on total has three attack nodes and the behavior of the attack nodes is varied when compared to the non attack nodes by changing the attributes of the routing protocol. Dynamic Source Routing (DSR) routing protocol is used as the protocol to route the packets in this simulation process and thus all the required scenarios are compared to estimate the performance of attack nodes and non attack nodes. When these scenarios are compared few graphs are achieved and they are explained, reviewed and given below
DSR metrics for three scenarios
DSR is used as the routing protocol and few metrics are set in this process and the comparison graphs of these metrics against the three scenarios are presented across this section. As given in the simulation procedure chapter DSR metrics like discovery time, routing traffic received, routing traffic sent, total cache replies sent, total packets dropped and total route errors sent are chosen to estimate the performance of the network against the intruder attacks. Now the respective comparison graphs obtained after running the simulation for 5 minutes for all the three scenarios is given in this section.
DSR route discovery time
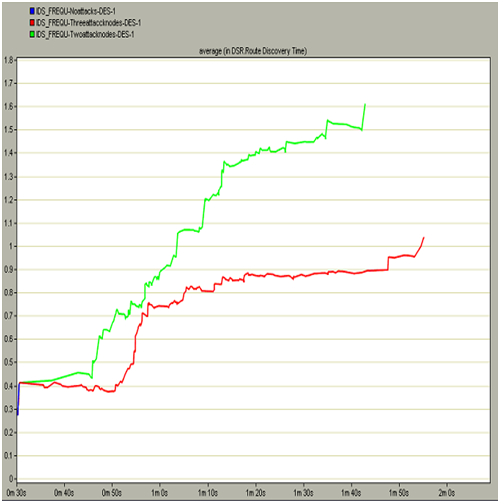
Route discovery time indicates the actual time to discover the required to reach the destination and in general this value should be less enough to ensure the fast communication across the nodes and server. If the route discovery time is more it implies that there is more packet drop across the network and thus the mobile nodes are sending the more route requests and the route is unavailable to be discovered. The actual route discovery time incurred in this simulation by the three scenarios is shown in the below screen
The average route discovery time incurred across the three scenarios is shown in the above graph. There are three different colors across the graph, where the blue color curve indicates the normal conditions where there are no attack nodes, green color indicates the scenario with two node attacks and the red color indicates that there are three attack nodes. When these curves are compared it is observed that the route discovery time taken by the first scenario is negligible when compared to the other two scenarios. The route discovery time taken by the two node attacks scenario is very high and almost the maximum taken in this context is around 1.6 seconds and this indicates that, there is lot of packet loss in this situation. It is also observed that the route discovery time taken by the three node attacks scenario is also more when compared with the first scenario and less than the two node attacks scenario and this is due to the reason that, when the third node starts working all the required damage to the route is done and thus no more route discovery options are executed and thus this value is less than the second scenario. This indicates that if there are some intruder attacks on the nodes, automatically the route discovery time is increased and finally the actual route is lost and thus lot time is consumed to identify the desired route for the communication and in this manner the frequency of the intruders will affect the overall performance of the network and they can be eliminated by comparing the route discovery time metrics.
DSR traffic routing sent in packets per second
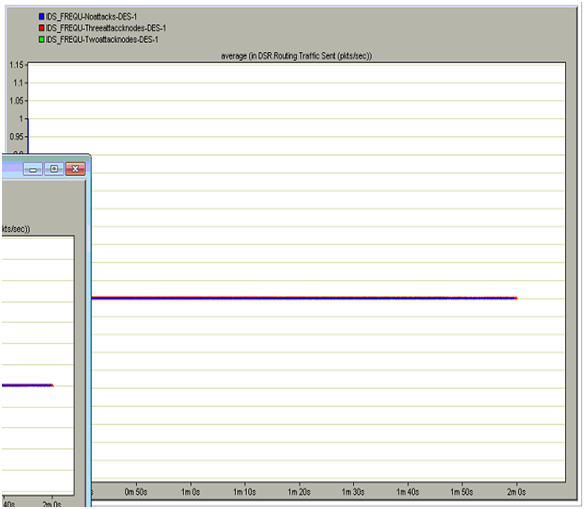
DSR routing traffic sent plays an important role in estimating the performance of the network and in general this should be less enough across the network for the optimal performance of the network. If the routing traffic is more then automatically it indicates that the intruders are sending more traffic across the network and thus they are making the neighboring nodes and the server busy in processing the intruder traffic. If the server and nodes are busy in processing the intruder traffic they will lose the actual traffic sent and thus intruders will totally impact the performance of the network on a whole. In this process the actual routing traffic sent by all the three scenarios is shown as below
From the above comparison graph it can be observed that more traffic is sent across the three node attacks scenario when compared to the first scenario and the two node attacks scenario. From the graph it is clear that, the total routing traffic sent across the network is more with the three intruder attack nodes as in general the intruders will more routing traffic across the network and with this the overall performance of the network is highly impacted due to this routing traffic on the network. It is also observed that an equal amount of traffic is sent by the normal scenario but it is less than the two attack nodes scenario as the two intruder attack nodes impose more routing traffic and due to the three attack nodes traffic is not sent across the network and from this it can be understood that the routing process is completely halted due to the three attack nodes. Thus from this analysis it can be concluded that if there are more frequency of the intruder attack nodes more routing traffic is sent across the network and the overall performance of the network is affected a lot and thus based on this traffic sent the actual intruder actions can be detected.
DSR routing traffic received in packets per second
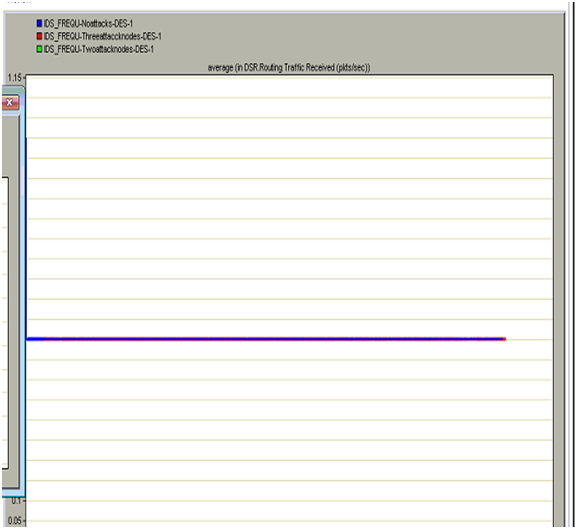
The actual DSR routing traffic received across the network due across the three scenarios is given in this section. If the routing traffic received is more it indicates that the intruder actions are imposing more traffic across the network and also this traffic received imposes the working conditions of the network to be deactivate. The overall routing traffic received across the network will be more when the frequency of the intruder attack nodes is more the traffic is more across the network.
From the above graph it is clear that the overall traffic received across the network due to the three attacks is more when compared to the first scenario and two attack nodes. Due to the impact of the intruder actions on the network more traffic is relieved at the destination and the server will received more intruder traffic when compared to the normal traffic. When the traffic received is more the server will discard all the routing packets from the non attack nodes and thus the communication is completely violated in this context. It can also be discovered that there is no traffic received from the two node attacks as the traffic sending and traffic received is complete halted and thus there is no traffic relieved in this context. From this analysis it is clear that if the traffic received is more than the intruder actions are more and in this way based on the intruder actions can be detected.
DSR total cache replies sent
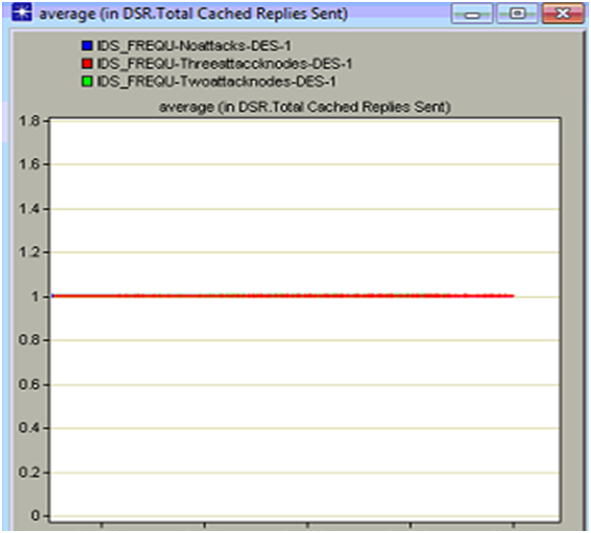
Cache replies indicates that the total number of replies sent by the server to the clients that were stored in the cache memory and in general these replies are sent to the clients where is some route loosening attitude of the nodes across the network. If the number of cache replies is more then it implies that there is lot of packet loss across the network and the nodes are frequently sending the route requests and this is common attitude of the intruder attack nodes across a wireless network. Now the total cache replies sent by the nodes across the three scenario created is given in the below comparison graph
It can be observed from the above graph the total cache replies sent by the server is more when there are some intruder attack nodes on the network. At the beginning of the simulation there are some cache replied due to the normal scenarios and later the total number of cache replies sent by the second scenario where there are two attack nodes and the cache replies sent by the third scenario where there are three attack nodes is more and these replies are sent till end of the communication process. In general where there are more cache replies across the network it indicates that there is lot of intruder traffic on the network and even if the frequency of the intruder attacked nodes increases the total number of cache replies are increases and thus there is lot of congestion across the network and also the total number of packet drops are increase exponentially. Thus when all the three scenarios are compared, more cache replies are sent when there are three attack nodes and thus it can be concluded that based on these number of cache replies the overall intruders on the network can be detected and prevented further.
DSR total packets dropped
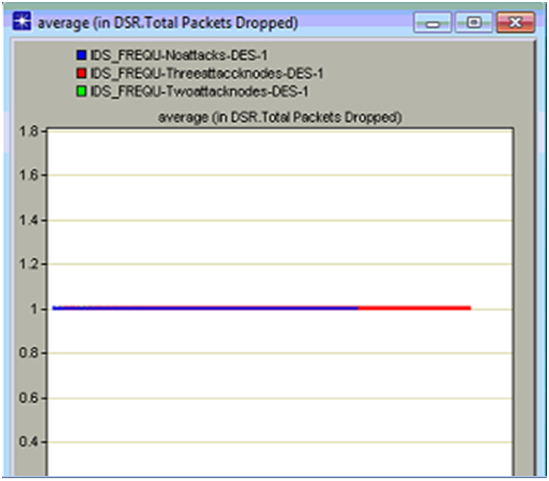
Packet drop across any network indicates the overall performance of the network in many aspects and in this simulation DSR routing protocol is used and the packet drop due to the intruder actions on the routing protocol parameters are estimated against the three scenarios created. Total number of packets dropped indicates that the anomaly traffic is more and due to this the actual traffic is lost by the nodes and the server and in this process the overall packets dropped is increased a lot and in this context the total packets dropped across the three scenarios is shown in the below comparison graph
From the above graph it can be observed that the total packets dropped is more when there are three attack nodes on the network. Initially there is some packet drop across the network even in the case of no attack nodes and this drop is due to the normal traffic conditions and the kind of the application is used across the network to generate the required traffic and in general the packet drop should be limited and the same proved across the simulation. When the three intruder attack nodes scenario is considered the packet drop is more as the intruder packets are more and due to these packets the actual packets are lost and in this process all the nodes will lose the actual data packets and in this context the total number of packets dropped is increased and this drop will continue till end of the simulation. There is no packet drop with two attack nodes and this is mainly due to the reason that when all the important data packets are lost by the three intruders attack nodes, there is no scope to drop the data packets and thus the packet drop is not recorded in this process.
DSR Total Route errors sent
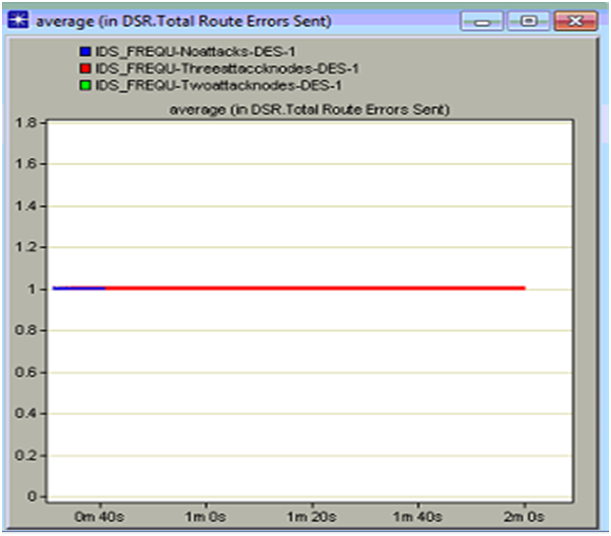
Route errors are common when there are some intruder actions across the network and if this error sent rate is more when the performance of the network is reduced a lot. In this context the total DSR route errors sent are analyzed and based on this the actual performance of the network against the intruder attacks is analyzed and the corresponding comparison graph is as given below
From the above graph it is clear that the total route errors is sent is more with the three intruder attack nodes when compared to the other scenarios. The total route errors sent with the no attacks scenario us very less when compared to the three attack nodes scenario and this is due to the reason that when there are some intruder attacks on the network, more route discovery attributes are set and due to this the average number of router errors are more and they are sent across the network. When the server receives the route errors it will start processing these requests and in this process will keep the normal nodes on hold for long time and due to this even the packet drop is also increased a lot. It can be observed from the comparison result that when there are two attack nodes there are no route errors across the network and from this it can be concluded that the routing process is completely stopped when the three attack nodes has manipulated the traffic and there is no traffic to be processed with two attack nodes.
Results analysis
Intruder actions and the corresponding detection mechanism is proposed in this simulation and in this context three scenarios are created and the simulation is run for 5 minutes to achieve the comparison result. From the comparison results that it is clear that when there are more intruder attacks on the network, the performance of the network is reduced a lot in terms of packets drops, route errors, cache replies sent, traffic sent and traffic received. In this simulation the frequency of the intruder is increased gradually and with the increase in the intruder attack nodes all the DSR routing protocol parameters are changed in terms of the performance like more intruder traffic is sent and received when there are three attack nodes. Even the aspects like router errors sent, cache replies sent and the total number of packets dropped is more with the three attack nodes scenario and from this the actual intruder actions can be detected and eliminated further. Route discovery time is also more with the attack nodes scenarios and thus the server is busy in sending the routing requests and in this process the actual data packets are lost and based on all these analysis and comparison graph the intruder actions can be identified and eliminated completely

