
The main aim of developing this Analysing Customer Loan QlikView project is to provide an easy way to extract, transform and load the information from the Microsoft Excel Sheet to remove synthetic key using renaming field name and concatenation.
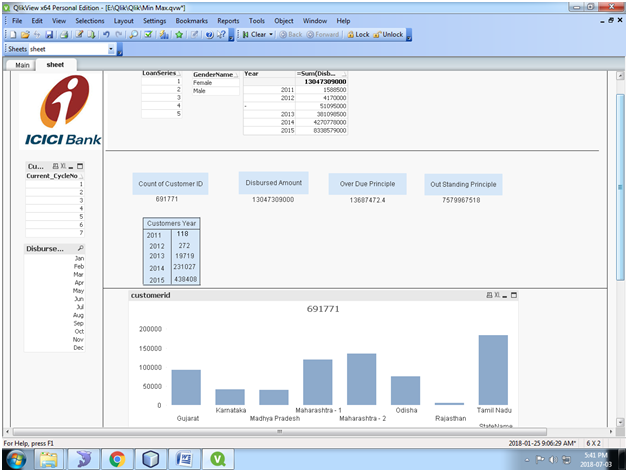
Here we are creating KPI’s to calculate customers number, disbursed amount, Over Due Principle amount, Outstanding Principle amount and sales on year wise, month wise, etc.
We can create Dashboards and analyze Customer Loan Data by using different types of Charts example Bar Chart, Pie Chart, Line chart, Pivot Table and Straight Table.
Calculate the below:
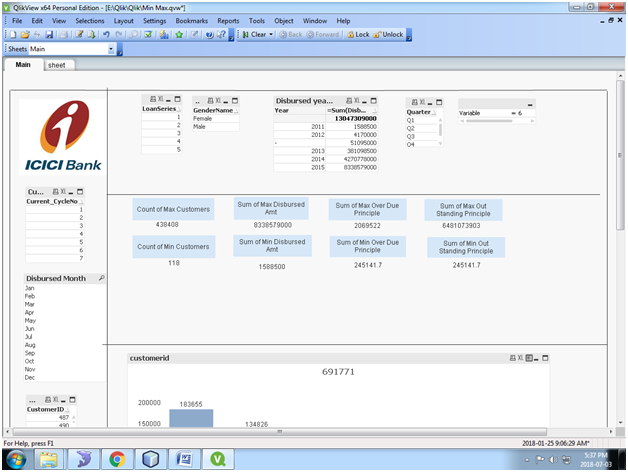
1) Minimum and Maximum customer values
2) Minimum and maximum Disbursed Amount Month Wise, Year wise.
3) Minimum and maximum Due Principle
Using Set Analysis to Analyze & Calculate the Data:
State and region wise Loan Analysis using Pie & Bar Charts:
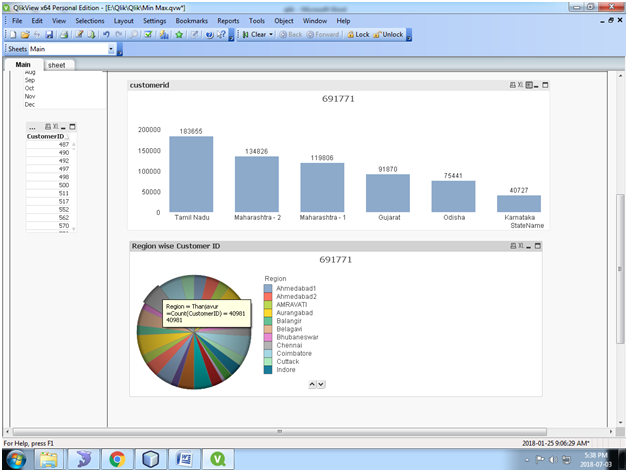
Area wise Distinct Customer Loan Analysis:
Download this Analyzing Customer Loan QlikView Project.